Edward Conard

Top Ten New York Times Bestselling Author

  • “…a must-read for serious students of economic policy.” - Glenn Hubbard, Dean, Columbia Business School, and former Chairman of the Council of Economic Advisers
  • “…a very valuable contribution.” - Larry Summers, former Secretary of the Treasury and director of the National Economic Council, president emeritus, Harvard University
  • “…a very valuable contribution.” - Larry Summers, former Secretary of the Treasury and director of the National Economic Council, president emeritus, Harvard University
  • “Unintended Consequences should be read by anyone who takes for granted the superiority of progressive taxation and has not thought carefully about the trade-offs involved.” - The New Republic
  • “…reminds us that inequality sends a signal of what society lacks most, in America’s case, entrepreneurship and risk taking.” - Lawrence Lindsey, CEO, The Lindsey Group, former Director of the National Economic Council
  • “…a must-read for serious students of economic policy.” - Glenn Hubbard, Dean, Columbia Business School, and former Chairman of the Council of Economic Advisers
  • “…challenges misconceptions that distort our economic debates.” - Arthur Brooks, President of the American Enterprise Institute
  • “Unintended Consequences is far smarter and more thought-provoking than most economics written for the general public” - Greg Mankiw, Harvard University, Former Chairman of the Council of Economic Advisors
  • “…a fresh argument for the productive value of inequality.” - David Autor, Professor of Economics, Massachusetts Institute of Technology
  • “…serious thinking for serious thinkers. …a thought-provoking blueprint for growing middle- and working-class incomes.” - Mitt Romney, former Governor of Massachusetts
  • “…a comprehensive explanation of the modern economy.” - Julian Robertson, Founder, Tiger Management
  • “…challenges misconceptions that distort our economic debates.” - Arthur Brooks, President of the American Enterprise Institute
Upside of Inequality Oxford Unintended Consequences
Buy the Books
  • Macro Roundup
  • About Roundup
  • About Ed Conard
  • Highlights
  • Topics
  • Subscribe
Edward Conard
  • twitter
  • facebook
  • linkedin
  • youtube

Macro Roundup

  • Email
  • Text Message (SMS)
  • Twitter/X
  • LinkedIn
  • Facebook
  • WhatsApp Message
Subscribe to Macro Roundup Emails
Select topics to choose: articles that mention them (broader) or articles mainly about them (focused)
  • Mentions 0
  • Primary focus 0
Showing all 7,361 Macro Roundup articles
When you search for any topic (like GDP, Inflation, or Banking), choose:
Choose search scope

Wednesday, September 1, 2021

The Consumption, Income, and Well-Being of Single Mother Headed Families 25 Years After Welfare Reform

AI Summary. Consumption growth among the lowest-consumption 10% of single-mother-headed families has outpaced that of single-mother families higher in the consumption distribution over a 25-year period following welfare reform.

Jeehoon Han National Bureau of Economic Research
Date Posted:
September 1, 2021
Is Database:
Database

Consumption growth of lowest decile of single mother headed families has outpaced those higher up consumption distribution over the past 25 years, according to @JeehoonHan @nberpubs.

Has consumption grown fastest among the poorest single-mother families?

Core argument: Over the 25 years after welfare reform, consumption growth for the lowest decile of single mother headed families outpaced that of families higher in the consumption distribution.

Over the past 25 years, the consumption growth of the lowest decile of single mother headed families has notably outpaced those higher up the consumption distribution. This trend highlights a significant shift in economic well-being among the most economically disadvantaged single mother families. Data indicates that while overall consumption levels have risen, the bottom decile experienced a more pronounced increase, suggesting targeted welfare reforms may have contributed to this improvement. The implications of this trend are critical for policymakers aiming to address income inequality and enhance support for vulnerable populations. As these families' consumption capacity grows, it reflects broader economic changes and potential shifts in social safety net effectiveness.
Takeaways by Macro Roundup® AI

  1. Over the 25 years after welfare reform, consumption growth for the lowest decile of single mother headed families outpaced that of families higher in the consumption distribution.
  2. Consumption levels rose across single mother headed families, with the bottom decile registering the more pronounced increase, which may reflect a contribution from targeted welfare reforms.

Jeehoon Han, Bruce Meyer and James Sullivan,"The Consumption, Income, and Well-Being of Single Mother Headed Families 25 Years After Welfare Reform," National Bureau Of Economic Research, August 2021, https://www.nber.org/papers/w29188

Ben Comment: Housing is a huge part of the growth in consumption for households but it seems like the measure of housing consumption is tightly linked to real estate value. With a long down trend in interest rates (and there for a long up trend in real estate prices), it seems like this measure of well being mechanically increases without actually changing someone’s well being. It would be nice to see consumption ex housing. Also interesting that the next category in which there’s the most consumption increase is food - which has notoriously volatile prices (this is why it’s stripped out of the core measure of inflation).

Bruce Meyer builds off his previous work on consumption inequality, his (consumption) results suggest, "...provide strong evidence that the material circumstances of single mothers improved in the decades following welfare reform..."

Bottom line, "... While some mothers undoubtedly fared poorly after welfare reform, the distribution shifted in favorable ways. The consumption of the lowest decile of single mother headed families has risen noticeably over time and at a faster rate than those higher up in the consumption distribution.Indications of improved well-being are evident in measures of expenditures on housing, food, transportation and utilities as well as in housing characteristics and health insurance coverage. The material circumstances of single mothers especially affected by welfare reform have also improved relative to plausible comparison groups. Median consumption of low-educated single mothers has risen relative to that of low-educated childless women and married mothers and relative to high-educated single mothers. This evidence during the period of the policy changes of the 1990s suggests that a combination of a reduction in unconditional aid and an expansion of aid conditional on work (with exceptions for those who could not work) was successful in raising material well-being for single mothers....It is important to note that although we find strong evidence that the material circumstances of single mothers improved in the decades following welfare reform, other components of well-being may have followed a different pattern. For example, these policy changes may have adversely, or positively, affected time spent with children, health, educational investments, outcomes for children, or other important outcomes.... It is also important to note that our evidence of improved economic circumstances does not imply that the level of economic well being for single mothers is high. In fact, the families that are the focus of this study have very few resources; average total annual consumption for a single mother with two kids in the bottom decile of the consumption distribution is about $14,000 in 2019...."
Premise, "...In this paper, we analyze changes in material well-being between 1984 and 2019, focusing on the period starting in 1993 with the welfare waivers that preceded PRWORA. We study single mother headed families—the primary group affected by the changes in tax and welfare policy. For these families, we analyze changes in income and consumption and other measures of well-being. We focus on consumption, particularly its most well-measured components, given its conceptual advantages over income as a measure of economic well-being as well as the pronounced underreporting of income in surveys..."

Income

"...Our results for income, which do not correct for underreporting,show that while income grew for single mothers, particularly during the years shortly after welfare reform, the pattern is quite different for the lowest income single mothers. For those in the bottom income decile, income falls sharply after welfare reform. We argue that these reported changes reflect the growing underreporting of income. The trends in consumption, on the other hand, show steady increases over a long period from at least the early 1990s up until 2007, with the largest increases apparent for the lowest decile, providing little evidence that the most disadvantaged families became worse off after welfare reform.Consumption has grown more slowly, if at all, for most deciles since the start of the Great Recession, although we continue to see a rise in consumption at the very bottom...."

Consumption

"... we find that all of the components of (well-measured) consumption have risen since the early 1990s—although food at home is flat at the bottom of the distribution of consumption—and that much of the rise in consumption is accounted for by increased consumption of housing, utilities, and gasoline and motor oil.Although homeownership rates have not increased, we do find increases in out-of-pocket rent for those who are renting, and this rise is accompanied with noticeable improvements in the characteristics of the living unit—more rooms, more amenities, and fewer housing problems. In previous work we had shown that health insurance coverage declined somewhat in the years immediately after welfare reform (Meyer and Sullivan, 2008). Since then, health insurance coverage for single mothers has expanded due to later expansions in coverage under the ACA...."

Reminder of what the consumption data is,

"...Our analyses primarily use consumption data from the Consumer Expenditure (CE) Interview Survey. The CE is a quarterly survey that provides comprehensive information on family spending for about 7,000 families each quarter (or about 5,000 prior to 1999). We use the surveys from the first quarter of 1984 through the first quarter of 2020. Surveys are administered throughout the three months of a quarter, and questions about expenditures typically have a reference period of the three months preceding the interview month. For each observation we specify the reference year as the year in which the majority of reference months fall. Our main analysis sample from the CE includes families headed by a single woman aged 18-54 who lives with her own children only and at least one child is under the age of 18, which excludes single mother headed families where other related or unrelated adults are present. We include observations with reference years for spending from 1984 to 2019, a period that spans many years prior to and after the implementation of the major reforms to the social safety net during the 1990s that we highlight...."Note they use PCE.

Comp shift in single mother population

"... There have been substantial changes in the composition of the single mother population over the last four decades. For example, single mothers in the 2010s were more likely to be Hispanic and more likely to attend college than those in1980s...Because our analysis focuses on the effects of tax and welfare reform on consumption growth, we exclude the influence of changes in the demographic composition of the single mother population by holding observable characteristics—age, education, and race/ethnicity of head— constant over time by re-weighting the samples from 1987-2019. Specifically, we first divide our sample from the first period (1984-1986) into 24 demographic cells defined by three variables: age (18-34, 35-54), education (high school dropout, high school degree, some college, College degree or above), and race/ethnicity (non-Hispanic White, non-Hispanic other race, Hispanic). These cells are defined broadly enough to ensure that none of the periods contain empty cells. We then use the share of the population in each of the 24 demographic cells to adjust the weights to hold constant demographic characteristics....

Changes in Income and Consumption of the Worst Off

"....Before we present our main results for consumption, we consider how income has changed for single mother headed families at different parts of income distribution from 1984 to 2019. Figure 3 shows the percent changes in after-tax income plus food stamps and housing subsidies relative to 1990-92 by income decile using the CPS ASEC. Because small annual samples can result in somewhat noisy estimates, we pool the annual data into 3-year intervals. These results indicate that in the 25 years following welfare reform income for single mothers above the bottom decile rose by 6 to 20 percent, but for those in the bottom decile it fell by 13 percent. Although these analyses use the CPS, in Appendix Figures 1a and 1b, we demonstrate that the results using the CE are broadly consistent with those from the CPS when we use pre-taxincome plus food stamps/SNAP as an income measure, which is defined compatibly in the two surveys..."

The Consumption, Income, and Well-Being of Single Mother Headed Families 25 Years After Welfare Reform: Comments Image 1


"... Figure 4 and Panel A of Table 1 show how consumption has changed for single mothers between 1984 and 2019 relative to the early 1990s for each of the bottom five deciles and the top half of the consumption distribution. These results differ sharply from those for income in two ways. First, unlike the income data indicating declines for single mothers in the bottom decile, consumption data indicate improvements at all deciles. Second, single mothers in the bottom income decile see the greatest decline in income, whereas single mothers in the bottom consumption decile experience the greatest rise in consumption. In particular, consumption for single mothers in the bottom decile rises by 39% between 1990-92 and 2017-19. The degree of consumption growth during this period declines monotonically as we move up the consumption distribution, with consumption in the top half of the distribution rising only by 19%...."

The Consumption, Income, and Well-Being of Single Mother Headed Families 25 Years After Welfare Reform: Comments Image 2

The Consumption, Income, and Well-Being of Single Mother Headed Families 25 Years After Welfare Reform: Comments Image 3


'... Between the early 1990s and 2005- 07, consumption increased by 31% for single mothers in the bottom decile and it increased by 25% for those in the top half. After 2005-07, consumption rose only modestly (by 1-6%) for those in the bottom five deciles, while consumption declined by 5% for those in the top half. In the following section, we consider the extent to which the improved material well-being is due to policy changes, as opposed to changes in macroeconomic conditions, by comparing the patterns of consumption for single mothers to those of other groups that are less likely to be affected by the policies. We verify that these patterns of rising consumption are robust to alternative appro­aches. For example, we find similar patterns when looking at a measure of total consumption (that includes components that are not well-measured). These results, which are reported in Appendix Figure 2, indicate that consumption for those in the bottom decile rose by 35% between the early 1990s and 2019, as compared to 39% growth for well-measured consumption. For the top half of the distribution, the growth in total consumption during this period is less pronounced (14%) than the growth in well-measured consumption (19%).In results not reported, we also verify that these patterns are not sensitive to how we account for the changing demographic composition of the single mother population over time..."

The Consumption, Income, and Well-Being of Single Mother Headed Families 25 Years After Welfare Reform: Comments Image 4


"... We report changes in median consumption for all three groups of low-educated women and by education for just single mothers (Figure 5). For the low-educated, median consumption rises noticeably for all three groups, but the rise is most pronounced for single mothers (Figure 5a). We also see that consumption rises more for low-educated single mothers than for high educated single mothers (Figure 5b). Between 1990-92 and 2017-19, ­median consumption rose by 33 percent for low-educated single mothers, while it rose by 17 percent and 24 percent for low-educated single women without children and married mothers, respectively, and by 18 percent for high-educated single mothers.For changes since 1990-92, the rise in consumption for low-educated single mothers is almost always greater than or equal to the rise for the comparison groups in every period. The relative rise in consumption for low-educated single mothers is more muted further down the distribution. At the 25th percentile, consumption rose more for low-educated single mothers than for low-educated single women without children or married mothers (Appendix Figure 3a) or for high educated single mothers (Appendix Figure 3b) over the full period, but for most of the period following welfare reform, growth in consumption is comparable across these groups. Nevertheless, even for this very disadvantaged group of low-educated single mothers, we do not find evidence that changes in welfare policies resulted in a decline in economic wellbeing relative to other groups that were not the target of the reforms. If one looks at total consumption (rather than its well-measured components, which is reported in Figure 5) the rise in relative consumption for single mothers is even more pronounced at the median(Appendix Figure 4) and 25th percentile (Appendix Figure 5)….”

The Consumption, Income, and Well-Being of Single Mother Headed Families 25 Years After Welfare Reform: Comments Image 5

The Consumption, Income, and Well-Being of Single Mother Headed Families 25 Years After Welfare Reform: Comments Image 6

  • Government Spending
  • Fiscal Policy
  • Workforce
    • Poverty/Crime

Wednesday, September 8, 2021

Unsheltered Homelessness: Trends, Characteristics, and Homeless Histories

AI Summary. Homeless populations declined in most US states, including large drops in Florida and Texas, while New York and California saw substantial increases, which the authors attribute to factors such as greater tolerance and policy changes including bail and jail release. New York City's unsheltered homeless count fell 38% to 2,376.

Samantha Batko, Alyse D. Oneto and Aaron Shroyer Urban Institute
Date Posted:
September 8, 2021
Is Database:
Database

Btw 2007 and 2020, the homeless population declined across most U.S. states, with notable exceptions in New York (NY) and California (CA), where homelessness increased significantly.

Do state policies explain why homelessness rose in some states?

Core argument: Between 2007 and 2020 the U.S. homeless population declined across most states, with New York and California the notable exceptions, where homelessness rose significantly, while Florida and Texas recorded large drops.

Between 2007 and 2020, the homeless population declined across most U.S. states, with notable exceptions in New York (NY) and California (CA), where homelessness increased significantly. While states like Florida (FL) and Texas (TX) experienced large drops, NY and CA saw substantial rises, driven by factors such as increased tolerance and policy changes like bail/jail release. In NY, despite a decline in shelter use from July 2020 to June 2021, the overall homeless numbers have risen since 2012. The unsheltered homeless population in NYC decreased by 38% to 2,376 in 2020, yet the broader state trend remains upward. This divergence highlights the complex interplay of local policies and economic conditions affecting homelessness trends.

Takeaways by Macro Roundup® AI

  1. Between 2007 and 2020 the U.S. homeless population declined across most states, with New York and California the notable exceptions, where homelessness rose significantly, while Florida and Texas recorded large drops.
  2. New York City's unsheltered homeless population fell 38% to 2,376 in 2020, even as New York State's overall homeless numbers have risen since 2012.
  3. The increases in New York and California are attributed to factors including greater tolerance and policy changes such as bail and jail release.

First, it seems like homelessness is going down nationally (graph later), but is increasing in NY and CA (these are state numbers). The graph below shows the increase in homelessness from 2007 to 2020. The pink is 2020 and the grey is 2007. You can see here that NY and CA are the only two states where homelessness has significantly increased. Other states like MA, MN and DC have seen smaller rises in homelessness while FL and TX have seen large drops in homelessness. This graph was presented onUSAFACTS.org(https://usafacts.org/data/topics/people-society/poverty/public-housing/homeless-population/) and the data were taken from HUD.

Second, I’ve been looking at NYC’s Department of homeless Services website (https://www1.nyc.gov/site/dhs/about/stats-and-reports.page). They have reports on the monthly number of homeless in shelters. It looks like there has been a steady decline in people in shelters from Jul-20 to Jun-21 (the latest numbers).

This is a pattern we see in other years as well, however, the overall level of homeless in shelters seems to have come down a little as well. I’ve included both FY 2020 and FY 2018 so you could get a sense of the overall level of homeless in shelters per-pandemic (2019 looked broadly similar):

That said, these recent numbers are up from the beginning of the available data (FY 2012):

One issue with these NYC numbers is that they are recording people in shelters - but there could be a significant number of unsheltered homeless people. (Note the NYT hasreportedthere are~ 2,000 homeless people sleeping on the streets/subways in Manhattan) The city is alsostarting to tacklethe problem more aggressively, “…"...On some days, city workers clear dozens of encampments. Advocates said that the sweeps are doing harm by upending homeless residents’ lives through aggressive tactics that discourage people from seeking or accepting the city’s help. “They are trying to make life so miserable on the streets that people will come into shelters, but that is a cruel and ineffective approach,” said Josh Dean, the founder ofHuman.nyc, a policy group focused on street homelessness...Still, the city has increased its number of cleanups during the pandemic. In 2020, from March 1 to Dec. 12, the city performed 1,077 cleanups, compared with 543 during the same period in 2019, according to figures the city released in response to a Freedom of Information Act request from the Safety Net Project of the Urban Justice Center. This year, between January and March 23 — even before the city ramped up the effort in May — there were 873 sweeps, compared with 94 sweeps in the same period in 2019..."

As to why homelessness seems more prevalent now, I have a theory but it’s not backed up by anything: During Covid, the city gathered the homeless in empty hotels for their safety and to stop the spread of covid. These hotels were empty because there were not tourists. Now the homeless have been kicked out of these hotels, but the tourists have not come back. I think the homeless are still fanning out from their collection points (the hotels) so they’re more concentrated than they once were AND, because tourism isn’t back to pre-covid levels/people aren’t back, the homeless make up a much larger percentage of the people you see than they used to. They basically stick out more. Again, this isn’t based on any of the numbers collected by that’s my current working hypothesis.

Overall it seems like national homelessness is going down while NYS homelessness is going up. However, while NYS homelessness is increasing, NYC homelessness is decreasing in both the sheltered and unsheltered communities with the latest numbers.

Neither number looks much like an outlier so it seems plausible to me.

According to the HOPE survey, there has been a 38% decrease in the unsheltered homeless population in NYC to 2376 with an implied unsheltered homeless population of ~3830 in 2020. Adding these two values to the graph I made (above) we have the graph below:

For the most recent data, the City has something called the HOPE Survey (Homeless Outreach Population Estimate;https://www1.nyc.gov/assets/dhs/downloads/pdf/hope-2021-results.pdf).

These data, however, only go through 2019 and are not as up to date as we’d like.

All that said, their report does say that overall homelessness is declining nationally:

Finally, from this report, is something I find heartening. In NYC it seems like all the unsheltered homeless are individuals as opposed to families (including children). The same cannot be said for other “hot spots” around the country:

And that homelessness is going up marginally in NYS compared to the real homeless hot spots out west:

The Urban Institute also has a report using these HUD data (https://www.urban.org/sites/default/files/publication/103301/unsheltered-homelessness.pdf). According to their report, it’s really the west coast that has the homeless problem, not the East coast:

From the graph, you can see we are currently above the long run average, but not by a lot - by about 400 people throughout the whole city.

I found HUD estimates of unsheltered homeless by county (https://www.hud.gov/2019-point-in-time-estimates-of-homelessness-in-US). I have taken NYC CoC (the geographical unit HUD uses for counting the homeless) and graphed unsheltered homeless per year (2007-2019) and graphed the average over that time frame:

From those numbers it suggests the city could be characterized as asleep at the switch in terms of homelessness going into pandemic?

Ed Comment 1/2: Why is "homelessness" growing or at least becoming a lot more visible? (They're all up and down Madison Ave). Population growth is slow, presumably the share of mentally ill/homeless isn't growing, and we are supposedly providing more money /housing. So they seem to be coming from somewhere else. If so, from where and why. Perhaps they were on "skid row"/out-of-sight and are now " allowed" on Madison's Ave. Perhaps higher benefits from NY and CA lured them from other places. Who has done serious thinking on this (I'm sure there is lots of partisan BS on this), and what do they say?

Ed Comment 2/2: Since it only seems to be increasing in CA and NY (and probably in a few other liberal cities), my guess is that it's related to a combination of increased tolerance and the bail/jail release. I think the jails are full of mentally ill. And a few more dangerous people in the gathering points of the homeless may drive many others out. Danger in shelters often seems cited as a reason for not using them. Consistent with that, we see a decline in shelter use. It wasn't clear if that's US of NY. A small change in national could be driven by a large change in local. I also think tolerance plays a big role. If you let them shelter on Madison Ave store fronts, why wouldn't they? If you let them pitch an urban tent, some people will economize on rent. Campgrounds are full of eager campers.

We couldn’t find anything that I would consider good research on homelessness. As you said, there were lots of things that seemed political (on the left things like income/wealth inequality and on the right things like easing police policy etc). Nothing that did a plausible job, in my estimate, of explaining the phenomena. But I did find some decent data that I’ll present here that give a good snapshot of what homelessness looks like right now in America (and NYC).

  • Historical
  • Workforce
    • Poverty/Crime

Your Fall 2021 syllabus

AI Summary. S&P 500 industry concentration reached an all-time high, drawing antitrust scrutiny, while gains in technology and communications extended beyond the five largest firms. With wages the largest component of business expenses, companies are increasingly using technology to lower unit labor costs and raise productivity, which the author argues will sustain demand for technology goods and services.

Michael Cembalest J.P. Morgan
Date Posted:
September 8, 2021
Is Database:
Database

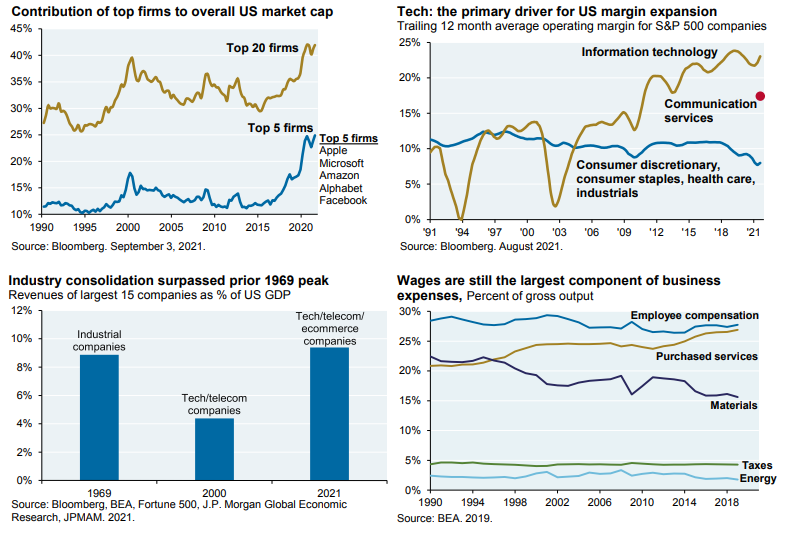
Tech plays a pivotal role in shaping corporate strategies & maintaining robust operating margins. Trailing 12 Month Average Operating Margin For S&P 500 Companies 1991-October 2021.

Will rising wage costs sustain business demand for technology?

Core argument: Industry concentration reached an all-time high over the period measured, drawing antitrust scrutiny.

The trailing 12-month average operating margin for S&P 500 companies from 1991 to October 2021 highlights significant economic trends. During this period, industry concentration reached an all-time high, drawing antitrust scrutiny. Despite this, the tech and communications sectors expanded beyond the five megacap firms, with secular growth tech stocks performing comparably to megacaps in 2021. As wages remain the largest component of business expenses, companies increasingly rely on tech to reduce unit labor costs and boost productivity. This trend suggests sustained demand for tech goods and services, with no expected mean reversion in sector profit margins. The data underscores the pivotal role of technology in shaping corporate strategies and maintaining robust operating margins amidst evolving economic conditions.

Takeaways by Macro Roundup® AI

  1. Industry concentration reached an all-time high over the period measured, drawing antitrust scrutiny.
  2. Tech and communications sector gains in 2021 extended beyond the five megacap firms, with secular growth tech stocks performing comparably to the megacaps.
  3. With wages the largest component of business expenses, companies increasingly rely on technology to reduce unit labor costs and raise productivity, a trend that suggests sustained demand for tech goods and services and no mean reversion in sector profit margins.

Some good factoids on concentration from JPM’s Michael Cembalset, "...Industry concentration is at an all-time high and is attracting antitrust attention. But the tech/communications services opportunity set is much bigger than the 5 megacap firms: secular growth tech stocks we discussed in our 2021 Outlook are performing in line with the megacap stocks this year, and carry a lot less antitrust baggage. As long as wages are the largest component of overall business expenses (last chart), the corporate sector will look to tech companies to help reduce their unit labor costs and improve productivity. In other words, we expect strong demand for technology goods and services to continue, and do not expect any mean reversion in sector profit margins...."

Your Fall 2021 syllabus: Extended Excerpt Image 1


Michael Cembalest, "Your Fall 2021 syllabus," J.P. Morgan, September 7, 2021, https://privatebank.jpmorgan.com/content/dam/jpm-wm-aem/global/pb/en/insights/eye-on-the-market/fall-2021-syllabus.pdf

Ed Comment: Doesn’t it suggest the IT sector is a significant cause of declining labor share? I also think that “software is eating the world.” Most every company’s product has a growing IT component of its value added/revenue. If that component looks like the IT sector, then IT is affecting labor’s share beyond the IT sector. How did you tag the labor share summary? Tag this to coincide with that.

  • Productivity
    • Institutional Capabilities
    • Intangibles
  • Comparisons
    • Historical
    • Sector
  • GDP
    • Financial Markets


Loading More Posts

End of content

No more pages to load

© Copyright 2026 Coherent Research Institute · All Rights Reserved · Privacy · Terms