Edward Conard

Top Ten New York Times Bestselling Author

  • “…a must-read for serious students of economic policy.” - Glenn Hubbard, Dean, Columbia Business School, and former Chairman of the Council of Economic Advisers
  • “…a very valuable contribution.” - Larry Summers, former Secretary of the Treasury and director of the National Economic Council, president emeritus, Harvard University
  • “…a very valuable contribution.” - Larry Summers, former Secretary of the Treasury and director of the National Economic Council, president emeritus, Harvard University
  • “Unintended Consequences should be read by anyone who takes for granted the superiority of progressive taxation and has not thought carefully about the trade-offs involved.” - The New Republic
  • “…reminds us that inequality sends a signal of what society lacks most, in America’s case, entrepreneurship and risk taking.” - Lawrence Lindsey, CEO, The Lindsey Group, former Director of the National Economic Council
  • “…a must-read for serious students of economic policy.” - Glenn Hubbard, Dean, Columbia Business School, and former Chairman of the Council of Economic Advisers
  • “…challenges misconceptions that distort our economic debates.” - Arthur Brooks, President of the American Enterprise Institute
  • “Unintended Consequences is far smarter and more thought-provoking than most economics written for the general public” - Greg Mankiw, Harvard University, Former Chairman of the Council of Economic Advisors
  • “…a fresh argument for the productive value of inequality.” - David Autor, Professor of Economics, Massachusetts Institute of Technology
  • “…serious thinking for serious thinkers. …a thought-provoking blueprint for growing middle- and working-class incomes.” - Mitt Romney, former Governor of Massachusetts
  • “…a comprehensive explanation of the modern economy.” - Julian Robertson, Founder, Tiger Management
  • “…challenges misconceptions that distort our economic debates.” - Arthur Brooks, President of the American Enterprise Institute
Upside of Inequality Oxford Unintended Consequences
Buy the Books
  • Macro Roundup
  • About Roundup
  • About Ed Conard
  • Highlights
  • Topics
  • Subscribe
Edward Conard
  • twitter
  • facebook
  • linkedin
  • youtube
  • Email
  • Text Message (SMS)
  • Twitter/X
  • LinkedIn
  • Facebook
  • WhatsApp Message
Subscribe to Macro Roundup Emails
  • Mentions 387
  • Primary focus 194
Showing 194 database articles primarily about Government Spending
Currently filtering by:
  • Remove Government Spending
  • Remove "primary topics only" restriction
  • Remove 'Database'
Show all 7,361 articles
For whatever topics you select (currently: Government Spending):
Choose search scope

Your importance filter 'Database' shows fewer articles.

Remove filters to see full article counts

U.S. government debt is not a ticking time bomb

AI Summary. Paying 3.5% interest on debt worth 120% of GDP imposes a burden comparable to the mid-1990s, when rates were near 7% and debt was about half as large relative to GDP. With the Federal Reserve expected to cut rates and inflation eroding the debt's real value, interest costs are projected to rise but remain manageable.

Noah Smith Noahpinion
Date Posted:
September 29, 2022
Is Database:
Database

Paying 3.5% interest on 120% of GDP is comparable to borrowing costs in the mid-1990s, when interest rates were around 7%.

Is the interest burden on government debt still manageable?

Core argument: Paying 3.5% interest on U.S. debt equal to 120% of GDP is comparable to borrowing costs in the mid-1990s, when interest rates were around 7% and debt was about half as large relative to GDP.

Paying 3.5% interest on 120% of GDP is comparable to borrowing costs in the mid-1990s, when interest rates were around 7%. Despite the U.S. debt being about twice the size relative to GDP compared to the 90s, the current interest rate environment is not as dire as it seems. The Federal Reserve anticipates cutting rates, which will moderate interest costs. Inflation is also eroding the debt, reducing its real value over time. Consequently, while interest costs are expected to rise, they are not projected to reach catastrophic levels. Instead, they may return to mid-90s levels, which is manageable. This suggests that U.S. government debt is not a ticking time bomb, although some fiscal austerity may be prudent to manage future costs effectively.
Takeaways by Macro Roundup® AI

  1. Paying 3.5% interest on U.S. debt equal to 120% of GDP is comparable to borrowing costs in the mid-1990s, when interest rates were around 7% and debt was about half as large relative to GDP.
  2. The Federal Reserve is expected to cut rates, which would moderate U.S. interest costs, while inflation erodes the real value of outstanding debt over time.
  3. U.S. interest costs are projected to rise but not to catastrophic levels, instead returning toward manageable mid-1990s levels, though some fiscal austerity may be prudent.

"..we’ll have to roll over about half of our government debt over the next 4 years or so. And we’ll have to roll it over at higher interest rates. So far, yields are only back up to the levels of the mid-2000s, and not yet back to 90s levels. But there are two problems here: Borrowing costs might go up more, as the Fed is forced to hike interest rates more and more in order to bring inflation down. We have to pay interest on a much bigger pile of government debt than we did in the 90s and 2000s…. As a percentage of GDP, our debt is about twice what it was in the halcyon days of the 90s and early 00s. That means paying 5% interest on that debt would be as costly as paying 10% interest would have been back in 1995 or 2005. (The story is similar if you look at debt as a percent of tax revenues.) So if something doesn’t change in the next 4 years or so, we could easily be paying 80s levels of interest costs on the federal debt….In the 80s, interest costs reached an astounding 50% of tax revenue! …Two silver linings So why am I not alarmed? Well, two reasons. First, interest rates probably aren’t going to stay high for that long. The Fed currently predicts that it will start cutting rates in 2023. And markets expect this to happen too:This will moderate the rise in interest costs a bit. Paying 3.5% interest on 120% of GDP will only be as painful as paying 7% interest would have been in the 90s. And in fact borrowing costs were about that high in the mid-90s. So this really isn’t too bad. And if inflation drops back to pre-pandemic levels, we can lower interest rates even more. The second reason for calm is that inflation itself is eroding the debt. Notice how government debt as a percent of GDP has been going down for the last couple of years? Part of that is GDP growth, but part of that is just inflation. The government kept borrowing money, but the entire existing debt stock was shrinking in real terms. The result is that in inflation-adjusted terms, government debt didn’t even rise in 2021 or 2022: In other words, we’re going to exit the current inflationary era with more expensive debt, but on a somewhat smaller amount of debt. And that debt erosion is permanent, even though higher interest rates will probably be temporary.Therefore I do see increased interest costs in our future, but not as apocalyptic as Druckenmiller says. A return to the costs of the mid-90s seems reasonable….”

Noah Smith, "U.S. government debt is not a ticking time bomb,"Noahpinion, September 29, 2022, https://noahpinion.substack.com/p/us-government-debt-is-not-a-ticking

U.S. government debt is not a ticking time bomb

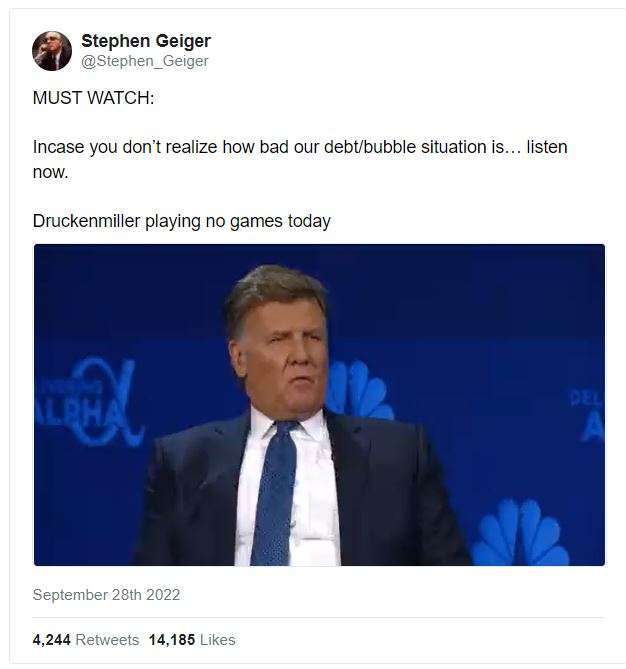
Some folks asked me to write a post about whether the U.S. debt is a ticking time bomb. They were alarmed by this viral video of retired hedge fund manager Stanley Druckenmiller declaring that U.S. debt service costs are about to eat the rest of the budget:

U.S. government debt is not a ticking time bomb: Extended Excerpt Image 1


Now, Druckenmiller is not a perennial prophet of doom and gloom, nor is he a perma-hawk who always warns that deficits and/or inflation are about to destroy the economy. He correctly warned of inflation as early as September 2020, but he does not appear to be one of the people who (wrongly) warned that quantitative easing would cause inflation back in the early 2010s. A lot of finance-industry macro guys will tell the crowd what they want to hear, but Druckenmiller seems like a straight shooter.

What’s more, some of his concerns are clearly appropriate. Higher interest rates will raise the amount of money that the U.S. government has to spend on debt service, and that will crowd out other types of government spending. And in the long run, we will probably have to either make cuts to entitlement benefits or find significant new sources of cost reduction, which can be a politically tricky thing to do.

Personally, though, I think things aren’t nearly as bad as Druckenmiller thinks. U.S. interest costs won’t rise catastrophically in the short term, and there’s not really a reason to expect interest rates to stay high for decades. Furthermore, inflation will itself erode some of the national debt, reducing long-term interest costs relative to GDP.

It does seem clear, though, that increased interest costs — and the Fed’s unwillingness to finance higher government borrowing — will force a bit of austerity in the years to come.

Interest costs are going up, but it’s not that bad yet

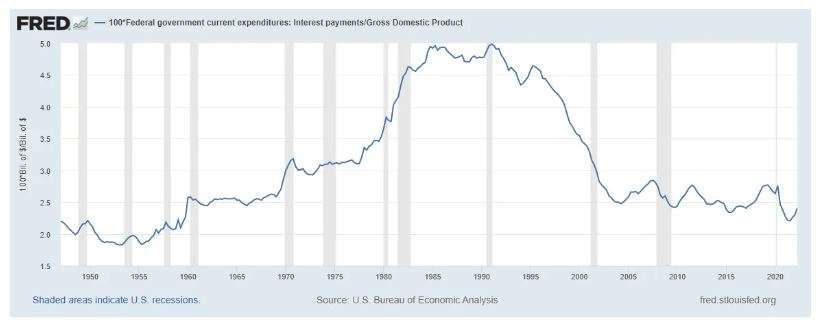
Here’s a long-term history of how much the federal government pays in interest payments, as a percent of GDP:

U.S. government debt is not a ticking time bomb: Extended Excerpt Image 2


You can see that interest costs fell during and after the pandemic and have now started to rise again. But they’re a long way from being anywhere close to what they were in the 1980s, when they reached almost 5% of GDP.

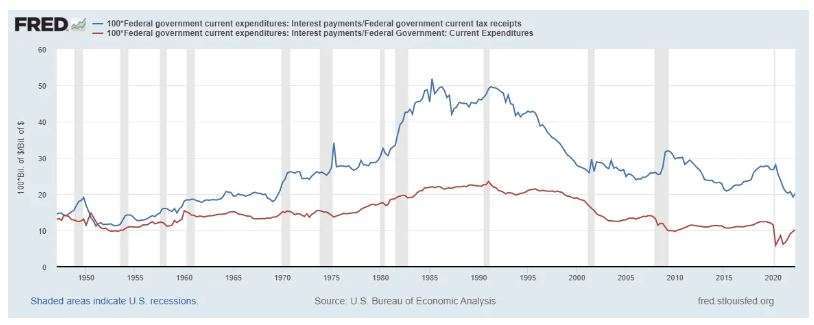
Now let’s look at interest payments as a percent of tax revenue and as a percent of government spending:

U.S. government debt is not a ticking time bomb: Extended Excerpt Image 3


In the 80s, interest costs reached an astounding 50% of tax revenue! This is because we raised interest rates in the 80s while also cutting taxes. For better or for worse, Reagan was not a particularly fiscally responsible President.

Right now, interest payments haven’t even begun to rise as a percent of tax revenue, and one big reason is inflation. Interest rates are set in dollar amounts, and inflation increases the number of dollars in the economy, meaning that tax revenues increase in dollar terms as well. That makes it easier for the government to make its interest payments. Remember, inflation erodes debt of all kinds.

The problem: rolling over the debt

So right now, interest costs are fine. But if interest rates keep going up, then interest costs will rise. The reason is that the U.S. government has to roll over its debt as the bonds reach maturity. And as it rolls over debt, it will have to borrow at a higher interest rate.

Now, this doesn’t happen all in one fell swoop. Not all of our government debt has to be rolled over immediately. If the government issued a 20-year bond in 2020 at near 0% interest rates, interest costs on that debt won’t go up for 18 more years. Right now, we have a bunch of outstanding bonds that were all issued at different times, and at different maturities. Figuring out how fast our existing debt needs to be rolled over actually takes some serious work.

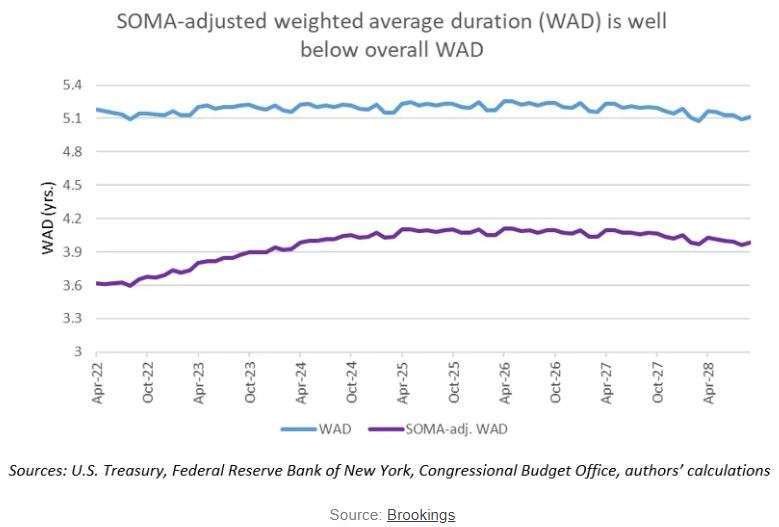
Fortunately, a team at Brookings has recently done this work. They found that the weighted average duration (WAD) of outstanding Treasury debt is a little over 5 years. And when you count “SOMA” debt that the Treasury owes to the Fed (which you probably should, since the Fed isn’t going to forgive that debt), the weighted average duration is only about 4 years.

U.S. government debt is not a ticking time bomb: Extended Excerpt Image 4


It seems like a big mistake to me that we didn’t borrow at longer maturities to lock in low interest rates for a very long time. In fact, we kept making this mistake right into the spring of 2021, when inflation had already started to accelerate. Had we had the foresight to lock in low rates for decades, we would be facing much less of an interest cost problem in the 2020s. But anyway, here we are.

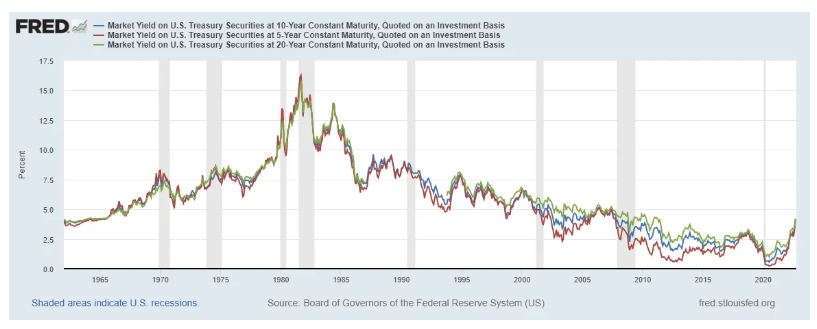
So we’ll have to roll over about half of our government debt over the next 4 years or so. And we’ll have to roll it over at higher interest rates. Here’s a historical chart of yields for 5-year, 10-year, and 20-year Treasury bonds, just to give you an idea of what we’re facing:

U.S. government debt is not a ticking time bomb: Extended Excerpt Image 5


In historical terms, this really doesn’t look that bad. So far, yields are only back up to the levels of the mid-2000s, and not yet back to 90s levels. But there are two problems here:

Borrowing costs might go up more, as the Fed is forced to hike interest rates more and more in order to bring inflation down.

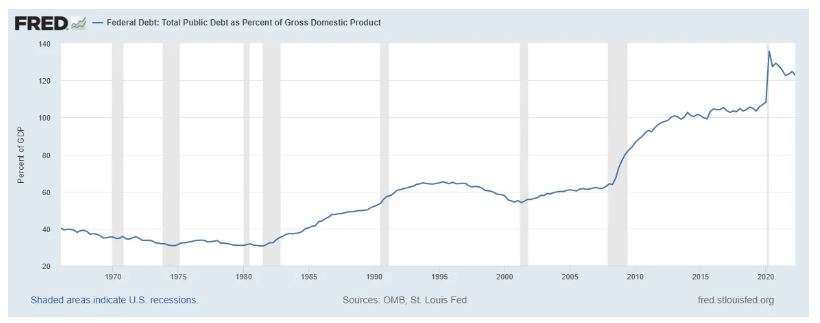
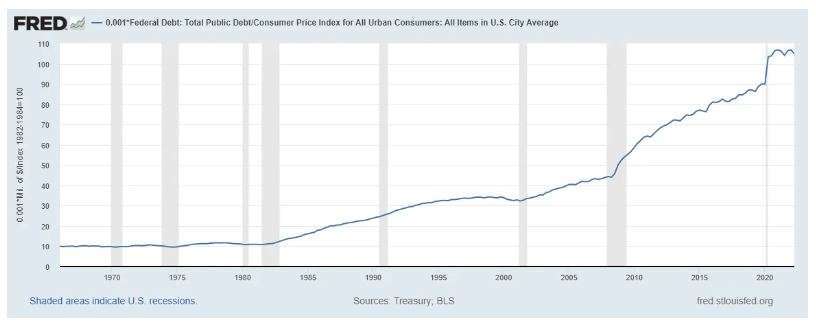
We have to pay interest on a much bigger pile of government debt than we did in the 90s and 2000s. Here’s government debt as a percent of GDP:

U.S. government debt is not a ticking time bomb: Extended Excerpt Image 6


As a percentage of GDP, our debt is about twice what it was in the halcyon days of the 90s and early 00s. That means paying 5% interest on that debt would be as costly as paying 10% interest would have been back in 1995 or 2005. (The story is similar if you look at debt as a percent of tax revenues.)

So if something doesn’t change in the next 4 years or so, we could easily be paying 80s levels of interest costs on the federal debt. In this sense, Druckenmiller’s warning is right.

Two silver linings

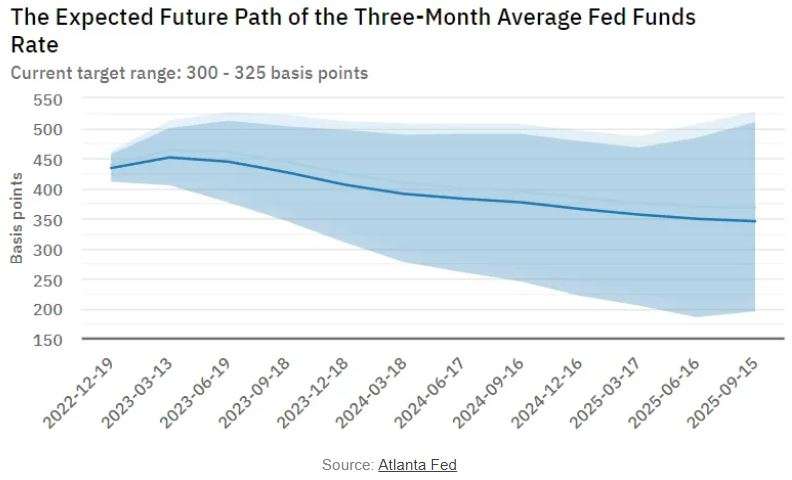
So why am I not alarmed? Well, two reasons. First, interest rates probably aren’t going to stay high for that long. The Fed currently predicts that it will start cutting rates in 2023. And markets expect this to happen too:

U.S. government debt is not a ticking time bomb: Extended Excerpt Image 7


This will moderate the rise in interest costs a bit. Paying 3.5% interest on 120% of GDP will only be as painful as paying 7% interest would have been in the 90s. And in fact borrowing costs were about that high in the mid-90s. So this really isn’t too bad. And if inflation drops back to pre-pandemic levels, we can lower interest rates even more.

The second reason for calm is that inflation itself is eroding the debt. Notice how government debt as a percent of GDP has been going down for the last couple of years? Part of that is GDP growth, but part of that is just inflation. The government kept borrowing money, but the entire existing debt stock was shrinking in real terms. The result is that in inflation-adjusted terms, government debt didn’t even rise in 2021 or 2022:

U.S. government debt is not a ticking time bomb: Extended Excerpt Image 8


In other words, we’re going to exit the current inflationary era with more expensive debt, but on a somewhat smaller amount of debt. And that debt erosion is permanent, even though higher interest rates will probably be temporary.

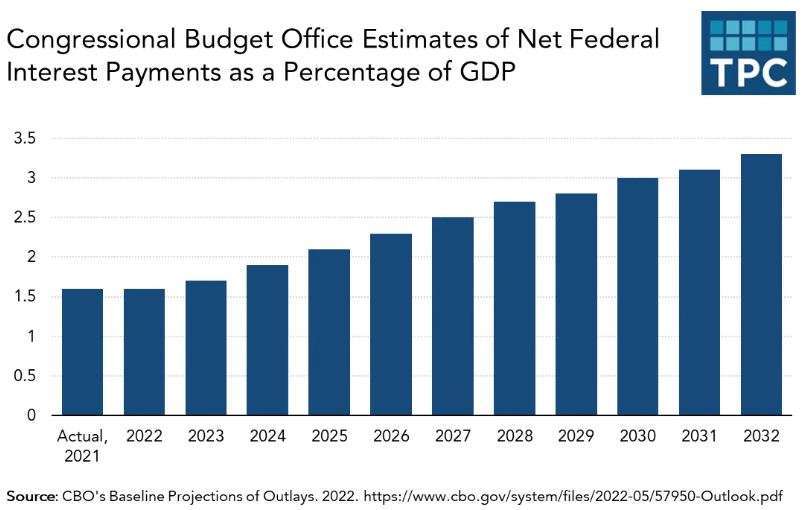
Therefore I do see increased interest costs in our future, but not as apocalyptic as Druckenmiller says. A return to the costs of the mid-90s seems reasonable. And in fact, this is exactly what the Congressional Budget Office projected, back in May:

U.S. government debt is not a ticking time bomb: Extended Excerpt Image 9


That’s not exactly a ticking time bomb.

But although I don’t think we’re headed for a debt-service catastrophe, I do think it would be wise to engage in a little bit of fiscal austerity over the coming decade.

A little bit of austerity won’t hurt

Fiscal austerity will accomplish a couple of purposes. First, it’ll help hold down debt service costs, and second, it will help bring inflation down faster.

During the long slow recovery from the financial crisis and the Great Recession, “austerity” became a dirty word, and with good reason. With borrowing costs ultra-low and the economy far below its potential, there was every reason to borrow cheaply and spend on fiscal stimulus, and countries that chose to ignore this imperative tended to suffer as a result.

But now, a decade later, the situation has changed entirely — the economy is running hot, borrowing costs are higher and rising, and inflation is the big problem. Both basic Keynesian theory and financial reality say that in the current situation, the government should cut back. The UK is now finding out what can happen when a government pushes its fiscal luck too far. We’re in a stronger place than the UK, but that doesn’t mean we’re infinitely strong. Cutting back a bit is only prudent.

But what spending can we cut?

First, let’s talk about entitlements. Most of this is Social Security, Medicare, and Medicaid. When folks like Druckenmiller warn of the dangers of long-term debt, they often talk about how entitlements are projected to explode in cost. The CBO is sort of complicit in this, as it regularly releases deficit projections that show debt going up exponentially starting any day now.

But these projections always assume two things: First, that we won’t cut Social Security, and second, that health care costs will keep increasing at historic rates. Neither of these is likely to be true. They say Social Security is the third rail of politics, but when the system was about to become unsustainable in the past, we quietly raised the retirement age. It’s likely that we’ll do this again. As for health costs, these are a problem whether they’re paid by the private sector or the public sector. But as it happens, health costs as a percentage of GDP have leveled off recently. So it’s quite possible — even likely — that the age when health care costs went up and up has come to an end.

But if entitlements aren’t really going to eat the economy, they also probably won’t get cut by very much. Nor will other social spending, much of which is also health care. If we can bring down health care costs, that will be a big deal (and I’ll talk a lot about this in an upcoming post). But it’s unlikely that we’ll slash government health benefits outright.

And as much as we’d all like to live in an era of peace, defense spending will also have to go up, due to the return of great-power conflict. We need to not only replenish the munitions we’ve been sending to Ukraine, but also bolster our forces for the possibility of an imminent conflict over Taiwan, as well as raise spending on the military modernization efforts that we’re undertaking to match Chinese power in the 2030s.

So if social spending is going to hold steady and defense spending are going to increase, how do we get austerity? The answer is “taxes”. Since World War 2, federal tax revenue has fluctuated between about 15% and 20% of GDP. We’re now at the middle of that range. So we’re going to have to go to the top of that range for a little while.

Higher taxes are painful, and much of that pain will inevitably be borne by the middle class as well as the rich. But that’s the cost of maintaining a welfare state while also protecting the country against external threats. Having a nation is simply an expensive proposition. For a long time, rock-bottom interest rates let us get away with ignoring that cost. That era is now over.

  • Government Spending
  • Fiscal Policy
    • Fiscal Deficits
    • Taxation
Previous articleSeptember 20, 2022Dont Believe the Hype About Antarcticas Melting GlaciersRecent media reports on Antarctic glaciers misrepresent scientific findings, exaggerating the rate of ice loss & its implications. Annual losses have increased from 40 gigatons in the 1980s to 250 gigatons in the 2010s, 0.001% of total ice.Next articleOctober 13, 2022The Sages of Wall StreetAnalysts consistently overestimated 2-year cumulative revenue growth forecasts by 4.3% and 3-year forecasts by 4.6% from 1997 to 2021 @BrianChingono
Showing 193 database articles primarily about Government Spending

The Fairest Way to Reform Social Security May Also Be the Worst Way to Grow the Economy

AI Summary. Fully closing Social Security's funding gap by raising the payroll tax rate would require an immediate, permanent increase from 12.4% to 17.6%, which would reduce labor supply and economic growth. Research on a prior benefit cut found affected Americans raised earnings by 61 cents per dollar of lost benefits, generating additional payroll tax revenue.

Andrew Biggs American Enterprise Institute
Date Posted:
May 28, 2026
Is Database:
Database
Is Important:
Important

Biggs argues that “fair” approaches to restoring Social Security solvency – those that do not cut already accrued benefits – are less effective than “unfair” ones that do, because the latter incentivize increased work effort, raising growth and revenue.

Biggs argues that “fair” approaches to restoring Social Security solvency – those that do not cut already accrued...

Does closing Social Security's gap with higher payroll taxes hurt growth?

Core argument: Keeping Social Security permanently solvent under the "fairness" model of paying accrued benefits in full would require an immediate and permanent payroll tax increase from 12.4% to 17.6%, which would decrease labor supply and reduce economic growth.

Imagine that Social Security reform follows the fairness model, in which accrued benefits are paid in full but the rate at which future benefits are earned is reduced. A simple way to do this is to increase the payroll tax rate To keep Social Security permanently solvent, meaning through 75 years and beyond, would require an immediate and permanent increase in the payroll tax rate [from] 12.4% to 17.6%. The higher rate would decrease labor supply and reduce economic growth. [Consider] an alternate reform, which looks clearly unfair: fix Social Security’s funding gap entirely by reducing accrued benefits that Americans already have earned. As of 2025, Americans had accrued $54 trillion in Social Security benefits. Social Security’s unfunded obligation as of 2025 was $26 trillion. So, roughly, this means cutting Americans’ “earned benefits” in half. [Analyzing the 1977 reform that undid the notorious 1972 “double-indexing” of benefits, a group of economists], using SSA earnings data, found that, for every dollar of lost benefits, the affected Americans increased their earnings by 61 cents. Moreover, these additional earnings would be taxed by Social Security, further strengthening the program’s finances. In effect, this makes cutting benefits a “cheaper” way to fix Social Security than raising taxes, because people respond in ways that also increase tax revenues.

Takeaways by Macro Roundup® AI

  1. Keeping Social Security permanently solvent under the "fairness" model of paying accrued benefits in full would require an immediate and permanent payroll tax increase from 12.4% to 17.6%, which would decrease labor supply and reduce economic growth.
  2. Americans had accrued $54 trillion in Social Security benefits as of 2025 against an unfunded obligation of $26 trillion, so closing the gap solely by cutting already-earned benefits would mean roughly halving those benefits.
  3. Economists analyzing the 1977 reform that undid the 1972 "double-indexing" of benefits found, using SSA earnings data, that affected Americans raised their earnings by 61 cents per dollar of lost benefits, earnings that Social Security would tax.

Related Articles:

  • Social Security and Trends in Wealth Inequality — The authors estimate that including Social Security in household wealth leaves top wealth shares little changed over three decades, with the top 10% and top 1% shares rising 1.1 and 1.6 percentage points versus roughly 9 and 6 points for marketable wealth alone. Social Security wealth grew from $7tn to $39tn.
  • How Federal Spending is Distributed by Age — An analysis classifying $4.4tn of $7tn in federal spending by age finds retirees aged 65 and older receive $2.7tn, 38.6% of total outlays and 61.9% of age-assignable spending, versus $1.2tn for working-age adults and $449bn for those under 26. Social Security and Medicare account for 80% of age-assignable spending on older adults.
  • The Great “Transfer”-mation — Government transfers rose from 8.2% of Americans' total personal income in 1970 to 17.6% in 2022, making them the third largest income source after work and investments. The share of U.S. counties drawing a quarter or more of personal income from transfers rose from under 1% in 1970 to 53% in 2022.
  • Government Spending
  • Fiscal Policy
    • Fiscal Deficits
    • Taxation

The World’s Most Surprising Capitalist Makeover Is Under Way in Sweden

AI Summary. Sweden has opened public services to private providers, with nearly half of primary healthcare clinics privately owned and one in three public high schools privately run, up from 20% in 2011. Its public social spending has fallen to 24% of GDP, similar to the US and below the over 30% in France and Italy.

Tom Fairless Wall Street Journal
Date Posted:
May 12, 2026
Is Database:
Database

Swedish public social spending is now 23.7% of GDP, just 1pp above that of the US and well under France’s 31.6%. Market-based reforms in the 1990s brought overall government spending down from 69.4% to 49.3% in 2024.

How has Sweden shrunk its state by privatizing public services?

Core argument: Sweden's total public social spending, covering healthcare, education and welfare payments, has fallen to 24% of GDP, similar to the U.S. and well below the over 30% of nations like France and Italy.

For decades, Sweden was shorthand for the brand of high-tax, high-spend government that managed people’s lives from cradle to grave through state-run hospitals, schools and care homes. No longer. With little fanfare, this Nordic country of 11 million has embraced capitalism. Today, nearly half of primary healthcare clinics are privately owned, many by private-equity firms. One in three public high schools is privately run, up from 20% in 2011. School operators are listed on the stock exchange. The capitalist makeover has allowed Sweden to do what few industrialized countries have managed in recent years: shrink the size of the state. That has enabled the government to sharply lower taxes and, economists say, sparked a surge in entrepreneurship and economic growth. Its total public social spending bill—which includes healthcare, education and all welfare payments—has fallen to 24% of gross domestic product, similar to the U.S. and well below the over 30% for nations like France and Italy. Sweden’s economy is expected to grow by around 2% a year through 2030, roughly the same pace as the U.S. and double the growth rates of France and Germany, according to an April forecast by the International Monetary Fund.

Takeaways by Macro Roundup® AI

  1. Sweden's total public social spending, covering healthcare, education and welfare payments, has fallen to 24% of GDP, similar to the U.S. and well below the over 30% of nations like France and Italy.
  2. Nearly half of Sweden's primary healthcare clinics are privately owned, many by private-equity firms, and one in three public high schools is privately run, up from 20% in 2011, with school operators listed on the stock exchange.
  3. An April forecast by the International Monetary Fund projects Sweden's economy will grow around 2% a year through 2030, roughly matching the U.S. and double the growth rates of France and Germany.

Related Articles:

  • How Sweden Overcame Socialism — After government spending reached 70% of GDP and public debt 80% of GDP, Sweden adopted market-oriented reforms including privatized healthcare services, for-profit schools, reduced welfare benefits, deregulation of electricity and transportation, and a corporate tax cut from 28% to 22%. Public debt has since fallen to 41% of GDP, with growth outpacing European Union peers by roughly 1 point annually.
  • Reforming the Welfare State: Recovery and Beyond in Sweden — Sweden's structural reforms — flexible exchange rates, inflation targeting, a smaller public sector, less generous social insurance, and deregulated markets — accompanied export-led growth, a current account surplus lasting over a decade, government spending falling to 52% of GDP, and central government debt dropping from nearly 80% of GDP to about half that.
  • The US Has One of the Highest Fertility Rates Among Peer Countries — The tempo-adjusted fertility rate, which accounts for shifts in the timing of births, shows the US rate falling since roughly 2009-10 and dropping below the 2.1 births-per-woman replacement level around 2017, reaching 1.82 in 2022. The US decline is less severe than in many peer countries.
  • Government Spending
  • Fiscal Policy
    • Fiscal Deficits
  • Politics

How Policy and Demographics Are Reshaping SNAP: From Families with Children to Older Adults

AI Summary. The share of the US population receiving food stamps doubled from 6% to 12% over roughly 25 years, with real costs per capita rising 179% to $279 a year, though both remain below their post-Great-Recession peak. Households with an elderly person now outnumber those with a child, reversing the early-2000s pattern.

Angela Rachidi American Enterprise Institute
Date Posted:
May 1, 2026
Is Database:
Database

About 40mm Americans, 12% of the population, receive SNAP benefits, up from 6% in 2000. In 2023, only 34% of these households included children, down from 49% in 2010, while 36% contained an elderly person, up from 16% in FY2010.

How have food stamp enrollment, costs, and recipient households changed?

Core argument: The share of the U.S. population receiving SNAP doubled from 6% in FY2000 to 12% in FY2025, while real SNAP costs per capita rose 179%, from roughly $100 to $279 per year in 2024 dollars.

Comparing FY2000 with FY2025, the share of the population receiving SNAP doubled from 6% to 12%, while real SNAP costs per capita increased by 179%—from roughly $100 per year to $279 (in 2024 dollars). Despite this growth, per capita participation and costs in FY2025 remained below their pre-pandemic peak in 2013, which coincided with the aftermath of the Great Recession and changes in eligibility and other policies stemming from the 2008 Farm Bill. SNAP is countercyclical, meaning that all else equal, the number of people receiving SNAP should rise during recessions because of increased unemployment and decline as the economy recovers, [though] overall SNAP participation has grown faster than changes in the unemployment rate alone would predict. Over the long run, and especially since FY2020 (due to the Thrifty Food Plan’s increase in the maximum SNAP benefit), costs per capita have not returned to prerecession levels after a period of high unemployment. In FY2023, the share of SNAP households containing an elderly person (36%) exceeded the share containing a child (34%) for the first time. This was a sharp departure from the early 2000s, when more than half of SNAP households contained a child and less than 20% included an elderly person (Figure 2).

Takeaways by Macro Roundup® AI

  1. The share of the U.S. population receiving SNAP doubled from 6% in FY2000 to 12% in FY2025, while real SNAP costs per capita rose 179%, from roughly $100 to $279 per year in 2024 dollars.
  2. In FY2023, the share of SNAP households containing an elderly person reached 36%, exceeding the 34% containing a child for the first time, against the early 2000s when over half contained a child and under 20% included an elderly person.

Related Articles:

  • The Great “Transfer”-mation — Government transfers rose from 8.2% of Americans' total personal income in 1970 to 17.6% in 2022, making them the third largest income source after work and investments. The share of U.S. counties drawing a quarter or more of personal income from transfers rose from under 1% in 1970 to 53% in 2022.
  • Poverty and Dependency in the United States, 1939–2023 — Extending a consistent poverty measure back to 1939, the authors estimate US absolute poverty fell from 48.5% to 19.5% between 1939 and 1963, driven by growth in market income rather than government transfers net of taxes. Poverty fell no faster in the 24 years after the War on Poverty than before.
  • Government Benefit Programs Already Do A Lot To Help Low Income Families — For a two-adult, three-child family, existing taxes and government benefits bring take-home resources to about $58,000 with no earnings, $79,000 with $20,000 of earnings, and $90,000 with $80,000 of earnings plus $15,000 in employer health premiums. A $75,000 gap in earnings and work-related benefits narrows to $11,000 in take-home pay.
  • Government Spending
  • Fiscal Policy
  • Workforce
    • Poverty/Crime

Washington’s Growing Portfolio: Tracking U.S. Government Investments

AI Summary. The U.S. government has invested $20.9bn across sixteen deals taking direct ownership stakes, expanding beyond its traditional toolkit of grants, loans, and tax incentives. The Department of Defense leads with seven deals, the Department of Commerce has six including a 10% stake in Intel, and partners have mobilized an additional $4.75bn.

Jonathan Hillman Council On Foreign Relations
Date Posted:
April 23, 2026
Is Database:
Database

Since January 2025, the USG has taken equity stakes totaling $20.9B in 16 American businesses. $8.6B, ~41% of the total, was invested in critical mineral miners and processors, while $8.9B, ~43% of the total, funded the government’s 10% stake in Intel.

Is the U.S. government taking direct equity stakes in companies?

Core argument: Since January 2025, the U.S. government has invested $20.9 billion across sixteen deals involving direct ownership, broadening a toolkit traditionally focused on grants, loans, and tax incentives.

Since January 2025, the U.S. government has invested $20.9 billion across sixteen deals involving direct ownership, broadening a toolkit that has traditionally focused on grants, loans, and tax incentives. The Department of Commerce has participated in six such deals, including taking a 10% stake in Intel. The Development Finance Corporation, the United States’ development bank, has executed three equity transactions in critical minerals, healthcare, and infrastructure. The Department of Defense leads the way with seven such deals. The U.S. government is also working with a range of partners and has mobilized an additional $4.75 billion in investment. Private co-investors include J.P. Morgan, Goldman Sachs, and others.

Takeaways by Macro Roundup® AI

  1. Since January 2025, the U.S. government has invested $20.9 billion across sixteen deals involving direct ownership, broadening a toolkit traditionally focused on grants, loans, and tax incentives.
  2. The Department of Defense leads with seven direct-ownership deals, followed by the Department of Commerce with six, including a 10% stake in Intel, while the Development Finance Corporation has executed three equity transactions in critical minerals, healthcare, and infrastructure.
  3. The U.S. government has mobilized an additional $4.75 billion in investment alongside private co-investors including J.P. Morgan and Goldman Sachs.

Related Articles:

  • Industrial Policy and Economic Security — Industrial policy justified on national security grounds requires weighing how much economic inefficiency is worth tolerating, since costs incurred today make a country poorer and therefore less able to project power later. The calculation is difficult because security gains are probabilistic and long-term economic costs are speculative.
  • The Cold War and the U.S. Labor Market — The authors estimate that declining U.S. military procurement spending from the 1950s to the 1990s explains roughly 18–30% of the decline in manufacturing employment and just under 10% of the rise in top-decile income inequality. They argue Cold War procurement raised demand for manufacturing workers and helped sustain tight labor markets for low-skill workers.
  • Capital Is Making a Comeback — Tangible investment in property, factories and equipment fell from 12.5% to 8.5% of private gross domestic product, while intangible investment in intellectual property, software and process knowledge rose from about 11.5% to 16.75%. The author argues demand for tangible capital investment will now have to rise.
  • Government Spending
  • Fiscal Policy
  • Politics
  • Productivity
    • Investment
  • Security

How Federal Spending is Distributed by Age

AI Summary. An analysis classifying $4.4tn of $7tn in federal spending by age finds retirees aged 65 and older receive $2.7tn, 38.6% of total outlays and 61.9% of age-assignable spending, versus $1.2tn for working-age adults and $449bn for those under 26. Social Security and Medicare account for 80% of age-assignable spending on older adults.

Kent Smetters University of Pennsylvania
Date Posted:
April 2, 2026
Is Database:
Database
Is Important:
Important

In 2025, of the 62.5% of Federal spending that is age-assignable on a per-capita basis, US retirees aged 65+ were given $43,700, working-age adults 26–64 got $7,300, and children and young adults got $4,300.

How is federal spending distributed across age groups?

Core argument: Retirees aged 65 and older receive $2.7 trillion of federal spending in fiscal 2025, equal to 38.6% of total outlays and 61.9% of age-assignable spending, versus $1.2 trillion for working-age adults aged 26–64.

We trace spending items within 52 general spending categories, totalling $7T for the 2025 Fiscal Year. We are able to classify a total of $4.4T across three broad age categories and assign the remaining $2.6T to an all-ages residual. Retirees (adults age 65 and older) receive $2.7T, equal to 38.6% of total federal outlays and 61.9% of age-assignable spending. Working-age adults (ages 26-64) receive $1.2T (27.9% of age-assignable), and children and young adults (under age 26) receive $449B (10.3%). The dominance of the retiree category reflects two programs above all others: Social Security and Medicare. Social Security directs $1.3T to retirees, and Medicare sends $835B. Together, they account for 80% of all age-assignable spending on older adults. But the retiree total extends beyond these two entitlements. Federal employee retirement benefits ($169B), housing assistance for older households, Medicaid long-term-care spending, and VA medical care all contribute, making the federal budget more retiree-focused than a Social Security–only lens would suggest.

Takeaways by Macro Roundup® AI

  1. Retirees aged 65 and older receive $2.7 trillion of federal spending in fiscal 2025, equal to 38.6% of total outlays and 61.9% of age-assignable spending, versus $1.2 trillion for working-age adults aged 26–64.
  2. Children and young adults under age 26 receive $449 billion, or 10.3% of age-assignable federal spending, out of $4.4 trillion classified by age within a $7 trillion budget, with $2.6 trillion assigned to an all-ages residual.
  3. Social Security directs $1.3 trillion and Medicare $835 billion to retirees, together 80% of age-assignable spending on older adults, with federal employee retirement benefits ($169 billion), housing assistance, Medicaid long-term care, and VA medical care contributing further.

Related Articles:

  • The Great “Transfer”-mation — Government transfers rose from 8.2% of Americans' total personal income in 1970 to 17.6% in 2022, making them the third largest income source after work and investments. The share of U.S. counties drawing a quarter or more of personal income from transfers rose from under 1% in 1970 to 53% in 2022.
  • France and Britain Are In Thrall To Pensioners — French pensioners receive larger government payments than in any other western country and begin receiving them several years earlier, leaving over-65s with higher average incomes than the working-age population — a situation without precedent internationally or in France's own history. Proposals to raise the retirement age or delay pension increases have triggered nationwide protests and government collapses.
  • The Budgetary Impact of the Abandonment of Federalism — Federal spending on activities originally regarded as state, local, or private-sector responsibilities is estimated to have risen from 2% of GDP in 1950 to 14% in 2019, exceeding the entire growth in federal spending over that period and reaching two-thirds of all federal outlays. Aid to individuals accounts for 80% of that increase, grants to states the remaining 20%.
  • Government Spending
  • Fiscal Policy
    • Fiscal Deficits
  • Healthcare/Seniors
  • Workforce
    • Poverty/Crime

Has the United States Bent the Health Care Cost Curve?

AI Summary. The authors estimate that a slowdown in US health care spending reflects technology-associated changes in health and site of care (21% of the slowdown, double that in Medicare), more elastic long-run supply (6%), market changes reducing and making demand more elastic (11–27%), improved population health (7%), and slower price growth net of upcoding (24%).

David Cutler and Lev Klarnet Brookings Papers On Economic Activity
Date Posted:
March 30, 2026
Is Database:
Database
Is Important:
Important

In 2024, medical spending as a share of GDP was just above its 2010 level and 15% ($977B) below its 2010 forecast; 21% of the gap was due to technology, 24% to price reductions, and 11–27% to reforms such as prior authorization and higher deductibles.

What explains the slowdown in US health care spending?

Core argument: Technology-associated changes in health and site of care account for 21% of the overall U.S. health care cost slowdown and double that share in Medicare, according to the authors' estimates.

Five factors are important in the slowdown in spending [Figure 16]. The first is technology-associated changes in health and site of care. These correspond to the subsequent innovations in our model. Together, technologies along these lines account for 21% of the overall cost slowdown and double that in Medicare. Second, long-run supply is more elastic than short-run supply, which lowers spending over time. This is particularly apparent in the impact of patent expiration for pharmaceuticals and in relative declines in imaging reimbursement. We estimate that greater long-run supply explains 6% of the spending slowdown. Third, a variety of market changes contribute to reduced and more elastic demand, including increased cost sharing paid by consumers, physicians not paid as much for using technologies, and insurers imposing restrictions on technology use - a rough guess is that these account for 11 to 27% of the spending slowdown. Fourth, the population is healthier in ways that reduce spending. This includes fewer hospitalizations for smoking-related conditions and reduced need for formal home health care. The birth rate has fallen as well, which reduces the need for care. We estimate improved population health explains 7% of the spending slowdown. A major component is slower price growth. Net of upcoding, we estimate lower price growth explains 24% of the spending slowdown.

Takeaways by Macro Roundup® AI

  1. Technology-associated changes in health and site of care account for 21% of the overall U.S. health care cost slowdown and double that share in Medicare, according to the authors' estimates.
  2. The authors estimate that slower price growth, net of upcoding, explains 24% of the health care spending slowdown, while market changes reducing demand — higher consumer cost sharing, lower physician payment for technology use, and insurer restrictions — account for a rough 11–27%.
  3. Improved population health explains an estimated 7% of the spending slowdown, through fewer smoking-related hospitalizations, reduced need for formal home health care, and a lower birth rate, while greater long-run supply elasticity explains 6%.

Related Articles:

  • Sick as a Dog — US healthcare stocks tracked technology-sector returns from 1989 to 2019 with lower volatility (15% vs 24%), but have since stagnated as technology advanced. Major pharmaceutical firms trade at forward price-to-earnings ratios of 8x–9x, biotech carries one of the market's largest valuation discounts, and 80% of biotech initial public offerings since 2018 have collapsed.
  • Saved by Medicaid: New Evidence on Health Insurance and Mortality from the Universe of Low-Income Adults — Using linked Census and tax records for 37m low-income adults, the authors estimate that state Medicaid expansions raised enrollment by 12 percentage points and cut mortality among low-income adults by 2.5%, implying a 21% reduction in the mortality hazard of new enrollees. They estimate direct budgetary costs of $5.4m per life saved and $179,000 per life-year saved.
  • The Great “Transfer”-mation — Government transfers rose from 8.2% of Americans' total personal income in 1970 to 17.6% in 2022, making them the third largest income source after work and investments. The share of U.S. counties drawing a quarter or more of personal income from transfers rose from under 1% in 1970 to 53% in 2022.
  • Government Spending
  • Fiscal Policy
    • Fiscal Deficits
  • Healthcare/Seniors
© Copyright 2026 Coherent Research Institute · All Rights Reserved · Privacy · Terms