Edward Conard

Top Ten New York Times Bestselling Author

  • “…a must-read for serious students of economic policy.” - Glenn Hubbard, Dean, Columbia Business School, and former Chairman of the Council of Economic Advisers
  • “Unintended Consequences represents the most cogent and persuasive analysis of the Financial Crisis to date.” - Andrei Shleifer, 1999 John Bates Clark Medal Winner
  • “…reminds us that inequality sends a signal of what society lacks most, in America’s case, entrepreneurship and risk taking.” - Lawrence Lindsey, CEO, The Lindsey Group, former Director of the National Economic Council
  • “Unintended Consequences is far smarter and more thought-provoking than most economics written for the general public” - Greg Mankiw, Harvard University, Former Chairman of the Council of Economic Advisors
  • “Unintended Consequences provides a provocative interpretation of the causes of the global financial crisis and the policies needed to return to rapid growth. Whether you agree or not, this analysis is well worth reading.” - Nouriel Roubini, New York University; Chairman, Roubini Global Economics
  • “…a very valuable contribution.” - Larry Summers, former Secretary of the Treasury and director of the National Economic Council, president emeritus, Harvard University
  • “…a comprehensive explanation of the modern economy.” - Julian Robertson, Founder, Tiger Management
  • “…a very valuable contribution.” - Larry Summers, former Secretary of the Treasury and director of the National Economic Council, president emeritus, Harvard University
  • “…reminds us that inequality sends a signal of what society lacks most, in America’s case, entrepreneurship and risk taking.” - Lawrence Lindsey, CEO, The Lindsey Group, former Director of the National Economic Council
  • “There are an amazing number of good ideas and interesting points made in Unintended Consequences. The thinking underlying it, and the obvious depth of understanding of the author, are very impressive.” - Steven Levitt, coauthor of Freakonomics; 2004 John Bates Clark Medal
  • “A full-throated defense of economic dynamism.” - The Wall Street Journal
  • “…challenges misconceptions that distort our economic debates.” - Arthur Brooks, President of the American Enterprise Institute
Upside of Inequality Oxford Unintended Consequences
Buy the Books
  • Macro Roundup
  • About Roundup
  • About Ed Conard
  • Highlights
  • Topics
  • Subscribe
Edward Conard
  • twitter
  • facebook
  • linkedin
  • youtube
  • Email
  • Text Message (SMS)
  • Twitter/X
  • LinkedIn
  • Facebook
  • WhatsApp Message
Subscribe to Macro Roundup Emails
  • Mentions 453
  • Primary focus 75
For whatever topics you select (currently: Growth):
Choose search scope

Your importance filter 'Database' shows fewer articles.

Remove filters to see full article counts

What’s the Matter With Miami?

AI Summary. A significant share of Florida's population inflow is retirees, and while the overall U.S. population grew 7.4% from 2010 to 2020, the population aged 65 and older grew 38.6%. Because retirees spend money on local services, the influx of seniors creates jobs for younger adults as well.

Paul Krugman Krugman Wonks Out
Date Posted:
August 4, 2023
Is Database:
Database

Florida’s growth relative to the population decline in Miami is driven by affordable housing and the baby boomers retiring. @paulkrugman notes that between 2010-20 the US population grew 7.4% but the share over age 65 grew 38.6%.

How does retiree migration drive local job growth?

Core argument: The U.S. population aged 65 and older grew 38.6% between 2010 and 2020, while the overall population grew 7.4%, creating a larger pool of potential retired migrants than in the past.

What are all those new Floridians doing for a living? Well, a significant number are retired. Retirees have been moving to Florida for the warm winters for a long time. But there are a lot more potential retired migrants now than in the past: between 2010 and 2020 the overall U.S. population grew only 7.4%, but the population 65 and older grew 38.6%. And since retirees spend money on local services, the influx of seniors creates jobs for younger adults as well.

Takeaways by Macro Roundup® AI

  1. The U.S. population aged 65 and older grew 38.6% between 2010 and 2020, while the overall population grew 7.4%, creating a larger pool of potential retired migrants than in the past.
  2. A significant number of Florida's new residents are retirees, continuing a long-standing pattern of migration to the state for its warm winters.
  3. Retirees moving to Florida spend money on local services, which creates jobs for younger adults as well.

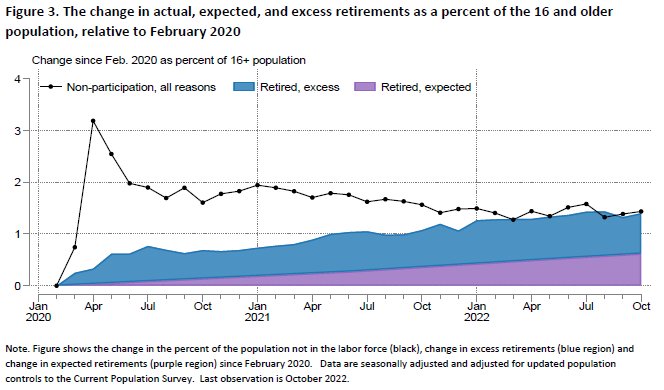
In October 2022, the retired share of the American population was 1½ percentage points above its pre-pandemic trend. These 3.5 million workers account for essentially all of the shortfall in labor force participation rates., “…Despite some improvement in the labor force participation rate for the working-age population since the early stages of the pandemic, the LFPR in October 2022 remained nearly 1½ percentage points below its pre-pandemic, February 2020 level (after making adjustments for changes in population weights introduced from the 2020 Census). The importance of retirements in accounting for this shortfall is illustrated in Figure 1, which shows the percentage of the working-age population that is not in the labor force for different reasons (black line) relative to February 2020, based on responses to the Current Population Survey. While earlier in the pandemic, factors other than retirements were an important contributor to elevated non-participation (such as non-participation while caregiving, the orange line), the percent of the population that was not in the labor force and retired (the “retired share”) has steadily increased and in October 2022 was almost 1½ percentage points above its pre-pandemic level, representing an increase of more than 3½ million retirees and accounting for essentially all of the total shortfall in the LFPR….”

Brandon Adams Comment: “This is a great paper. I think the labor force participation rate could converge toward its pre-pandemic trend line faster than envisioned in this paper. The paper ignores asset markets altogether, and it seems clear to me that rapidly inflating retirement accounts in 2021 was a big part of this story. Towards the tail end of the time period covered in this paper, retirees met the unwelcome duo of rapidly decreasing asset prices and rapidly increasing consumer prices. This might or might not bring people in their 60s or 70s out of retirement, but it will almost surely slow the exit rate of those aged 40-60, and it might also bring back into the labor force some people in that age range who are currently sitting out.”

The Evidence The pre-pandemic trend, “…Even in the absence of the pandemic, the retired share would likely have risen, albeit more gradually, due to shifts in the age distribution of the population toward ages traditionally associated with higher retired shares (primarily, the movement of the Baby Boomer cohort into older ages). As one illustration of the importance of population aging, Figure 2 plots the retired share (solid line) alongside a counterfactual trend (dashed line)….”

“…. This trend is an estimate of how the retired share would have evolved in the absence of the pandemic and is derived by assuming the continuation of pre-pandemic, age-specific trends in retired shares, assuming the state of the business cycle remained similar to pre-pandemic levels, and accounting for the actual changes in the age distribution over this period (in section III, we discuss in more detail the calculation of this and other counterfactual retired shares). Over the five years prior to the pandemic, the retired share increased about 0.2 percentage point per year, and plausibly would have continued increasing at a similar pace in the absence of the pandemic. As of October 2022, the retired share remained 0.6 percentage point above the pre-pandemic expected trend, or about 1.6 million people (Figure 2). This gap between the actual and expected lines is an estimate of “excess retirements,” and the excess retirements gap remains sizeable. In fact, the retired share was slightly below trend just prior to the pandemic (about 0.2 percentage point), implying that excess retirements as a share of the population have increased by about 0.8 percentage point since February 2020, or about 2.1 million people. That increase in excess retirements explains a little more than half of the 1.4 percentage point increase the total retired share since February 2020, whereas the increasing expected retired share explains the rest (see Figure 3)….”

“…Thus, less than half of the increase in the retired share to date would likely have occurred even in the absence of the pandemic, suggesting that more than half of the current LFPR shortfall is a direct result of the pandemic on retirement….First, as discussed above, more than half of the increase in the retired share relative to February 2020 is due to an increase that would have been expected in the absence of the pandemic. Second, about two-thirds of the total increase in the excess retired share is attributable to those who were age 65 and older at the start of the pandemic, with a particularly sharp increase in excess retirements among those age 70 and older. The remaining one-third of the increase in the excess retired share is attributable to those age 55 to 64 when the pandemic began. Third, there is also substantial heterogeneity across education, race, and ethnic groups, with retired shares for those age 65 and older increasing more than expected for Whites relative to Blacks and Hispanics, and for those with a college education relative to those without….…Because the retired share has remained significantly elevated since increasing substantially at the start of the pandemic and has shown little sign of converging towards its ex-pandemic counterfactual, it may take some years for retirement behavior to normalize relative to pre-pandemic norms and for the retired share of the population to converge toward what it would be in the absence of pandemic-related influences. We view it as unlikely, however, that the retired share will fall substantially towards its pre-pandemic trend and that those who retired early will return to the labor force in large numbers, since most of the excess retirements are concentrated among people who are 65 and older who (given their age) would likely be retiring in greater numbers anyway over the next few years. That assessment is supported by the stabilization of the unretirement rate at its pre-pandemic level, well below the level it would need to reach for the retired share to fall substantially…”

Joshua Montes, Christopher Smith, and Juliana Dajon, ” “The Great Retirement Boom”: The Pandemic-Era Surge in Retirements and Implications for Future Labor Force Participation,” Federal Reserve Board, November 2022, https://www.federalreserve.gov/econres/feds/the-great-retirement-boom.htm

Related Articles:

  • Miami Sees Its First Population Drop in Decades — Miami-Dade County lost 79,535 residents to net migration to other parts of Florida and other states over a recent multiyear stretch, an analysis of U.S. Census Bureau data by the Brookings Institution found, and the county's population shrank despite partial offset from foreign immigration. Miami home prices rose 53%.
  • A $100 Billion Wealth Migration Tilts US Economy’s Center of Gravity South — Six fast-growing Southern states — Florida, Texas, Georgia, North and South Carolina, and Tennessee — now contribute more to US GDP than the Northeast, including the Washington-New York-Boston corridor. The Southeast accounted for more than two-thirds of US job growth since the pandemic began, nearly double its pre-pandemic share, and housed 10 of the 15 fastest-growing large American cities.
  • Florida Ocean Temperatures At ‘Downright Shocking’ Levels — Much of Florida is recording its warmest year on record, with temperatures 3–5 degrees above normal and coastal waters in the Florida Keys reaching 92–96 degrees versus the more typical upper 80s. The National Oceanic and Atmospheric Administration reports about 40% of the world's oceans face a marine heat wave, the highest share on record.
  • Growth
  • GDP
    • Housing
Previous articleAugust 4, 2023The Case For Continued American Equity ExceptionalismRebecca Patterson argues US equity outperformance is likely to continue as US firms are positioned to capture a sizable share of productivity benefits from new technologies like AI, and the US is likely to experience stronger relative economic growth.Next articleAugust 4, 2023Big Pharma's Big Tax Dodge.@Brad_Setser argues tax reform is needed as the American pharmaceutical sector has optimized its corporate structure to shift almost all of its domestic profits overseas paying an effective tax rate of 3%.
Showing 75 database articles primarily about Growth
Currently filtering by:
  • Remove 'Database'

The AI Boom’s Two Engines

AI Summary. The author argues the AI boom's economic significance lies more in stock market gains than in data center construction, and that the inability to monetize AI investments could end the boom. Simulations using the Federal Reserve's FRB/US model suggest that an end to the buildout plus a roughly 30% market decline would slow growth to about 1.5%, short of recession.

Jason Furman Econvitals
Date Posted:
November 9, 2026
Is Database:
Database
Is Important:
Important

Furman estimates that the data-center buildout, which began in mid-2024, had raised US GDP by only ~0.3% by 2026Q3, as the equipment is largely imported and the US was already near full employment. Counting AI-driven stock market gains, the effect rises to ~0.6%. If the buildout ended and stocks fell ~30%, growth would slow to ~1.5%.

How would an end to the AI boom affect growth?

Core argument: If the AI data center buildout ended and the stock market fell about 30%, the FRB/US model predicts growth would slow to roughly 1½ percent, short of even a shallow recession.

The data center buildout is set to be among the largest investment expansions in peacetime American history. How different is our economy today because of it? The answer, based on a simulation using the large-scale macroeconomic model used by the Federal Reserve (FRB/US), is not much. The buildout by itself has raised GDP by only about 0.3%, because most of the investment is imported, and imports do not add to U.S. GDP or lower the unemployment rate. The stock market boom that came with it matters more—together they have raised GDP by about 0.6% and lowered the unemployment rate by about 0.3 percentage point.This analysis suggests that the economy could survive less data center buildout just fine. Investment would fall, but so would imports and interest rates, and GDP would be little changed. A broader fall in the stock market would be a bigger deal, The bottom line: so far the AI economy is less a story about data centers than about the stock market—and that is also where the risk is.

Takeaways by Macro Roundup® AI

  1. If the AI data center buildout ended and the stock market fell about 30%, the FRB/US model predicts growth would slow to roughly 1½ percent, short of even a shallow recession.
  2. The economy could withstand less data center buildout, making the AI economy so far less a story about data centers than about the stock market, which is also where the risk lies.
  3. Public policy changes or an inability to monetize AI investments could stop the AI boom, and financial-system complexities such as unwinding leverage, absent from the FRB/US model, pose a tail risk resembling 2001 more than 2007–09.

Related Articles:

  • Change Is Accelerating Because It’s All Interconnected — The authors estimate that artificial intelligence equity valuations discount roughly 3.5% annual productivity growth and trend nominal output growth well above the recent past, while consensus forecasts and broader markets imply growth closer to recent experience. On that basis, either AI stocks or broader macro markets are meaningfully mispriced.
  • The S&P 500 And Cembalest’s “AI Universe” After The Midterms — An "AI universe" index of 42 stocks groups companies into three categories: 28 direct AI firms including NVIDIA, Microsoft, Alphabet, Amazon, Meta and Broadcom; 8 AI-linked utilities such as Vistra, NextEra and Constellation; and 6 capital equipment makers including Eaton, Quanta and GE Vernova.
  • US Labor Productivity Increases at Fastest Pace in a Year — US labor productivity, measured as nonfarm business output per hour, rose at a 3.6% annualized rate, up from an upwardly revised 2.1% pace, while unit labor costs fell 0.7%. The acceleration suggests a capital spending boom is translating into greater efficiency, according to Bureau of Labor Statistics data.
  • Growth
  • GDP
    • Business Cycle
    • Financial Markets
  • Productivity
    • Innovation/Research
    • Investment

Higher Utilisation Explains The Recent Surge In Productivity Growth

AI Summary. Measured total factor productivity growth is estimated to come almost entirely from higher input utilisation rather than underlying efficiency gains, based on a method that infers unobserved capital and labour utilisation from movements in hours per worker. On this evidence, recent productivity gains reflect "working harder" rather than "working smarter.

Shane Boyle, John Fernald and Huiyu Li Center For Economic and Policy Research
Date Posted:
August 5, 2026
Is Database:
Database

US labor productivity has accelerated, with output per hour growing at a mean annual rate of 2.5% btw 2023–2026Q1, ~1pp above its 2005–2019 pace. The gains have largely been driven by higher input utilisation, which is ‘inherently temporary.”

Does higher input utilisation explain recent measured productivity growth?

Core argument: Since the beginning of 2024, utilisation growth accounts for essentially all measured total factor productivity growth, suggesting the measured productivity gains derive from "working harder" rather than "smarter".

Input utilisation is not observed directly for the entire economy;  it must be inferred. Consider a firm that wants to meet strong demand but has a given capital stock, workforce, and technology. It can ask its existing workers to work longer (which we observe). It can also run its capital longer. Each margin is costly, for example, overtime pay, so firms typically use all of them at once. The observed margin serves as a proxy for the unobserved ones. The method infers changes in industry utilisation from observed movements in hours per worker, scaled by an estimated pass-through of those movements into labour productivity. Industry estimates are aggregated using Domar weights, which reflect each industry’s importance. The stacked bars in Figure 2 show measured TFP growth split into [Fernald's] measure of utilisation growth in light grey and utilisation-adjusted TFP growth in dark grey. In 2023, utilisation growth was a drag on measured TFP growth, and utilisation-adjusted TFP growth soared. Since the beginning of 2024, however, utilisation accounts for essentially all TFP growth. For now, the measured productivity gains appear to derive from “working harder” rather than “smarter.”

Takeaways by Macro Roundup® AI

  1. Since the beginning of 2024, utilisation growth accounts for essentially all measured total factor productivity growth, suggesting the measured productivity gains derive from "working harder" rather than "smarter".
  2. In 2023, utilisation growth was a drag on measured TFP growth while utilisation-adjusted TFP growth soared, according to Fernald's decomposition of measured TFP.
  3. Economy-wide input utilisation is not observed directly and is inferred from movements in hours per worker, scaled by an estimated pass-through into labour productivity, with industry estimates aggregated using Domar weights.

Related Articles:

  • Productivity During and Since the Pandemic — Total factor productivity growth since early 2021 has run only slightly above its 2010–19 average, suggesting the 2020 productivity surge reflected cyclical dynamics layered on a continuation of the slow pre-pandemic trend. Productivity has since grown somewhat faster than the authors' analysis predicted, but remains well below the 1995–2004 pace.
  • The Impact of AI on the U.S. Labor Market — Using observed AI usage data across 321 U.S. occupations, the authors estimate that highly exposed occupations saw a 6.7% decline in real wage growth with no detectable employment effects. The estimated declines are concentrated among the lowest earners, with service workers down 24.3% and the bottom wage quartile down 10.7%, while top earners show no significant effect.
  • Why Wages And Productivity Look Set To Diverge Further — In the US, Europe and Japan, pay growth has decoupled from productivity growth, with productivity pulling ahead. US labor productivity, measured as real GDP per hour worked, is more than 5x its 1947 level while real hourly compensation is only about 3x, and median wage growth lags even further behind.
  • Growth
  • GDP
  • Productivity

Why Wages And Productivity Look Set To Diverge Further

AI Summary. In the US, Europe and Japan, pay growth has decoupled from productivity growth, with productivity pulling ahead. US labor productivity, measured as real GDP per hour worked, is more than 5x its 1947 level while real hourly compensation is only about 3x, and median wage growth lags even further behind.

Joel Suss Financial Times
Date Posted:
July 27, 2026
Is Database:
Database
Is Important:
Important

In advanced economies, increases in labor productivity growth have decoupled from real wage growth, especially post-1980.

Are wages falling further behind productivity growth in advanced economies?

Core argument: US labour productivity, measured as real GDP per hour worked, is more than five times its 1947 level, while real hourly compensation is only about three times greater.

In the US, Europe and Japan, pay growth has decoupled from productivity growth, with the latter having pulled ahead. US Labour productivity — measured as real GDP per hour worked — is now more than five times greater than in 1947, whereas real hourly compensation is only about three times greater. Median wage growth has lagged even further behind productivity growth, with inequality pushing the average wage higher than the median. (The figures above show average rather than median wages; plotting median wages would show an even greater divergence.)

Takeaways by Macro Roundup® AI

  1. US labour productivity, measured as real GDP per hour worked, is more than five times its 1947 level, while real hourly compensation is only about three times greater.
  2. Pay growth has decoupled from productivity growth in the US, Europe and Japan, with productivity pulling ahead in all three.
  3. Median wage growth has lagged productivity growth by even more than average wage growth, as inequality pushes the average wage above the median.

Related Articles:

  • The Record Divide Between Corporate Profits and Worker Pay — Labor's share of gross domestic income fell to 51%, the lowest since records began in 1947, while profits' share rose to 12.1%, the highest since 1950. Inflation-adjusted hourly wages are up 3% since the end of 2019, compared with a 50% rise in profits.
  • AI and Productivity — The recent pickup in US labor productivity appears driven by higher utilization of existing capital—running factories, server racks, and hotel rooms harder—rather than by firm-level efficiency gains from AI. Adoption remains too thin and the cross-sectional evidence too weak to conclude that AI-driven productivity gains are already widespread.
  • Understanding Trends in Worker Pay over the Past 50 Years — Productivity growth has been unequal across industries, across firms within industries, and across workers within firms, slowing growth in both the productivity and the pay of the median worker. The authors argue that working- and middle-class men earlier received "breadwinner rents"—pay above their marginal value to employers—and then endured slow wage growth as women's workforce participation rose.
  • Growth
  • Productivity
  • Workforce
    • Inequality
    • Wages/Income

What the World Cup Revealed About America

AI Summary. About 73m US households hold retirement accounts, mostly defined-contribution plans whose balances have risen $6.7tn, and 45m households account for nearly $15tn in annual outlays, close to 3x Germany's economy and 70% of China's GDP. This group's spending has sustained faster growth than comparably wealthy economies.

Jason Thomas Carlyle
Date Posted:
July 21, 2026
Is Database:
Database
Is Important:
Important

Citing the spending of the top 45mm US households, Jason Thomas argues that US economic growth could be characterized less as ‘k-shaped’ than “travelling at two speeds, one roughly the same rate as Europe’s and another that’s racing far ahead.”

Does retirement wealth explain why US spending outpaces peer economies?

Core argument: Balances in US defined-contribution retirement plans have risen by $6.7tn since the start of 2019, a 12.7% annually compounded gain, with roughly 73 million US households holding retirement accounts.

Roughly 73 million US households have retirement accounts (primarily defined-contribution plans like 401ks) that consist primarily of claims on businesses whose revenue growth and market values provide another hedge against inflation. Balances in defined contribution plans have increased by $6.7 trillion (+12.7%, annually compounded) since the start of 2019. US personal savings rates have fallen sharply over the past year (from 5.5% in April 2025 to 3% in May 2026) but that seems entirely rational. If your retirement balance is far above where you expected it to be, why not spend a bit more of your current income than previously intended? If we net across these overlapping cohorts and exclude recent first-time home purchases, we’re left with 45 million households that combine to account for nearly $15 trillion in annual outlays. That’s an extraordinary sum, equal to nearly 3x the size of the entire German economy and 70% of the GDP of China. And this third of the population has not only been insulated from the inflation shock but also exhibits the propensity to spend out of wealth and income to an extent that’s sustained a far higher rate of GDP growth than observed in economies with comparable living standards.

Takeaways by Macro Roundup® AI

  1. Balances in US defined-contribution retirement plans have risen by $6.7tn since the start of 2019, a 12.7% annually compounded gain, with roughly 73 million US households holding retirement accounts.
  2. Netting overlapping cohorts and excluding recent first-time home purchases leaves 45 million US households accounting for nearly $15tn in annual outlays, equal to nearly 3x the German economy and 70% of China's GDP.
  3. The US personal savings rate fell from 5.5% in April 2025 to 3% in May 2026, a decline the article argues is rational when retirement balances sit far above expectations.

Related Articles:

  • K-Shaped Economy? — Available spending data does not support the narrative of a bifurcated "K-shaped" consumer economy: surveys show households earning under $50,000 reported spending growth of 5%, versus 4.6% for those earning over $100,000. Government data show the top income decile's share of aggregate spending at 22.8%, down from 23.4% a year earlier.
  • The K-Shaped Economy’s Defining Statistic Has Some Problems — The widely cited estimate that the top 10% of US earners account for 45% of consumer spending comes from a method combining Federal Reserve survey and financial-accounts data. Its author says he is more confident in the trajectory—a significant, consistent rise in the top 10% and 20% shares over 30–35 years—than the level.
  • The Two Europes — The International Monetary Fund projects Eastern European economies will close much of the gap with US per capita GDP — Poland from 34% to 67%, Romania 27% to 60%, Lithuania 29% to 69% — while Western Europe slips, with France falling from 86% to 71% and Italy from 93% to 68%.
  • Growth
  • GDP
  • Politics
  • Workforce
    • Inequality

Cataloging Growth: A Re-Evaluation of 1900–1990

AI Summary. Using 5.1m product listings from Sears catalogs, the authors construct a quality-adjusted price index implying much lower goods inflation for 1900–1990 than standard deflators, with real goods consumption growing 39x rather than 10.3x. They estimate faster growth before World War II (5.4% a year, 1900–1939) than after (4.2%, 1946–1980).

Verónica Bäcker-Peral and Benjamin Wittenbrink Massachusetts Institute of Technology
Date Posted:
July 20, 2026
Is Database:
Database
Is Important:
Important

Using 5.1mm Sears catalog listings and LLM-based hedonic estimation, this study finds real goods consumption grew 39-fold from 1900 to 1990, not 10.3-fold as official data imply, with the largest mismeasurement concentrated before WWII.

Does quality-adjusted pricing show faster goods consumption growth before the war?

Core argument: Using a quality-adjusted price index built from 5.1 million Sears catalog listings, the authors estimate real goods consumption grew by a factor of 39 between 1900 and 1990, compared with a factor of 10.3 using standard goods deflators.

Measuring real GDP growth requires distinguishing changes in prices from changes in product quality... systematic quality adjustment. price indexes are unavailable for much of the twentieth century. We construct a new quality-adjusted price index using 5.1 million product listings from Sears catalogs, 1900–1990. The resulting cost-of-living index implies substantially lower goods inflation than conventional deflators between 1900 and 1990, real goods consumption grew by a factor of 39 using our index,compared with a factor of 10.3 using standard goods deflators. Figure 5 shows our estimates of the cost-of-living index for consumer goods in the solid red line. The dashed black line shows average cumulated price changes for the same sample of consumer goods. The gap.is largest before World War II, reversing the conventional view that goods consumption growth was slower before 1945 than in the post-war decades.As Gordon puts it, 'the history of price changes from 1914 to 1947 [is] the black hole where little is known.' This paper sheds light on that black hole. We estimate average annual real goods consumption growth of 5.4% for 1900-1939 and 4.2% for 1946-1980... the era of fastest growth was in the prewar, not postwar, contrary to conventional estimates.

Takeaways by Macro Roundup® AI

  1. Using a quality-adjusted price index built from 5.1 million Sears catalog listings, the authors estimate real goods consumption grew by a factor of 39 between 1900 and 1990, compared with a factor of 10.3 using standard goods deflators.
  2. The authors estimate average annual real goods consumption growth of 5.4% for 1900–1939 and 4.2% for 1946–1980, implying the fastest growth came in the prewar rather than postwar era, contrary to conventional estimates.
  3. The new cost-of-living index implies substantially lower goods inflation than conventional deflators, with the gap largest before World War II, a period Gordon describes as "the black hole where little is known.".

Related Articles:

  • European vs. U.S. Economic Performance: An Update — Productivity growth from 2000-2019 was higher in the US than in western Europe, but almost half the gap disappears when information and communications technology is excluded, even though tech was 9.2% of US output versus 5.4% in the EU. The author estimates this difference in industrial mix accounts for roughly 40% of the overall productivity growth gap.
  • Is The Great Stagnation Actually Just a ‘So-So’ Stagnation? — Long-running U.S. tests show population average reading scores moved from 255 to 256 out of 500 and math from 266 to 271, despite educational attainment rising more than three years. The author argues that if added schooling has not raised productivity, measured total factor productivity growth has been understated, shrinking the apparent "Great Stagnation" by about a third.
  • Growth
  • GDP
    • Inflation

Can Africa Take The Asian Path To Growth?

AI Summary. Sub-Saharan Africa's cereal output is nearly 5x its 1960s level, but most gains came from cultivating more land rather than higher yields, and arable land per person has been falling for decades. Food and Agriculture Organisation data show cereal yields flat in recent years, with most African countries recording lower agricultural total factor productivity than a decade earlier.

Economist Staff The Economist
Date Posted:
July 15, 2026
Is Database:
Database

Most Sub-Saharan African countries had lower agricultural TFP in 2023 than they had a decade earlier. Btw 2008 and 2019, in the face of a rapidly rising population, small farms’ yields were falling by 3 to 4% per year.

Is Africa's crop growth coming from more land, not higher yields?

Core argument: Sub-Saharan Africa's farmers grow nearly five times as much cereal, such as maize and rice, as in the 1960s, but most of those gains came from cultivating more land rather than raising output per hectare.

In aggregate [sub-Saharan Africa's] farmers are growing more cereals, such as maize (corn) and rice, than ever: nearly five times as much as in the 1960s. But most of those gains came from cultivating more land, which cannot go on for ever. The amount of arable land per person has been falling for decades, and now sits at roughly the global average. That might not matter if farmers were also growing more crops per hectare. But recently gentle growth in agricultural productivity has given way to stagnation, perhaps even decline. Consider figures drawn from national statistics in Africa by the Food and Agriculture Organisation. Cereal yields did not grow between 2020 and 2024, the latest data point. Nor did total factor productivity (TFP), a measure of how efficiently inputs of all kinds (such as labour and machinery) are turned into produce. Most African countries had lower agricultural TFP in 2023 than a decade before.

Takeaways by Macro Roundup® AI

  1. Sub-Saharan Africa's farmers grow nearly five times as much cereal, such as maize and rice, as in the 1960s, but most of those gains came from cultivating more land rather than raising output per hectare.
  2. Cereal yields in Africa did not grow between 2020 and 2024, and neither did total factor productivity, a measure of how efficiently inputs such as labour and machinery are turned into produce, according to Food and Agriculture Organisation figures drawn from national statistics.
  3. Arable land per person in sub-Saharan Africa has been falling for decades and now sits at roughly the global average, while most African countries had lower agricultural total factor productivity in 2023 than a decade before.

Related Articles:

  • 21st-Century Africa Governance and Growth — Sub-Saharan Africa's GDP per capita has fallen relative to the world average over three decades, from 30% to 22%, reflecting the region's inability to sustain growth. Had it grown at the global pace since 1990, income per capita would be over 40% higher; at emerging East Asia's pace, nearly 3x higher.
  • Africa Needs 1 Billion Jobs by the End of the Century. Where Will It Find Them? — Africa's population, now about 1.5bn, is projected to reach 4bn by 2100, with sub-Saharan Africa approaching 3.5bn and Nigeria's working-age population forecast to exceed 320m. Between 2005 and 2020, Congo, Nigeria, Ethiopia and other large states averaged only one job created for every two entrants to the working-age population.
  • Changing Sub-Saharan Africa’s Growth Trajectory — Sub-Saharan Africa's working-age population is growing nearly 3% a year, versus close to zero in much of the world, and is projected to exceed China's within about a decade and reach a quarter of the global total. With modest productivity growth near 2%, the region is likely among the world's fastest-growing.
  • Growth
  • GDP
  • Productivity
  • Workforce
    • Demographics
© Copyright 2026 Coherent Research Institute · All Rights Reserved · Privacy · Terms