Edward Conard

Top Ten New York Times Bestselling Author

  • “…reminds us that inequality sends a signal of what society lacks most, in America’s case, entrepreneurship and risk taking.” - Lawrence Lindsey, CEO, The Lindsey Group, former Director of the National Economic Council
  • “Unintended Consequences represents the most cogent and persuasive analysis of the Financial Crisis to date.” - Andrei Shleifer, 1999 John Bates Clark Medal Winner
  • “…a comprehensive explanation of the modern economy.” - Julian Robertson, Founder, Tiger Management
  • “Unintended Consequences offers deep and well-argued analyses on almost every issue.” - The New York Times
  • “…serious thinking for serious thinkers. …a thought-provoking blueprint for growing middle- and working-class incomes.” - Mitt Romney, former Governor of Massachusetts
  • “…a comprehensive explanation of the modern economy.” - Julian Robertson, Founder, Tiger Management
  • “A full-throated defense of economic dynamism.” - The Wall Street Journal
  • “…a fresh argument for the productive value of inequality.” - David Autor, Professor of Economics, Massachusetts Institute of Technology
  • “…challenges misconceptions that distort our economic debates.” - Arthur Brooks, President of the American Enterprise Institute
  • “Unintended Consequences should be read by anyone who takes for granted the superiority of progressive taxation and has not thought carefully about the trade-offs involved.” - The New Republic
  • “…a must-read for serious students of economic policy.” - Glenn Hubbard, Dean, Columbia Business School, and former Chairman of the Council of Economic Advisers
  • “…reminds us that inequality sends a signal of what society lacks most, in America’s case, entrepreneurship and risk taking.” - Lawrence Lindsey, CEO, The Lindsey Group, former Director of the National Economic Council
Upside of Inequality Oxford Unintended Consequences
Buy the Books
  • Macro Roundup
  • About Roundup
  • About Ed Conard
  • Highlights
  • Topics
  • Subscribe
Edward Conard
  • twitter
  • facebook
  • linkedin
  • youtube

Macro Roundup

  • Email
  • Text Message (SMS)
  • Twitter/X
  • LinkedIn
  • Facebook
  • WhatsApp Message
Subscribe to Macro Roundup Emails
Select topics to choose: articles that mention them (broader) or articles mainly about them (focused)
  • Mentions 0
  • Primary focus 0
Showing all 7,336 Macro Roundup articles
When you search for any topic (like GDP, Inflation, or Banking), choose:
Choose search scope

Friday, August 4, 2023

The Startup Surge Continues: Business Applications on Track for Second-Largest Annual Total on Record

AI Summary. Americans filed nearly 2.7m business applications in the first half of the year, up 5% from the prior year and 52% above the same period in 2019. One-third were applications with a high likelihood of hiring employees, 36% above the comparable 2019 total.

Daniel Newman Economic Innovation Group
Date Posted:
August 4, 2023
Is Database:
Database

Based on first-half new business formation, 2023 will be just shy of 2021’s record number of new firms likely to hire employees. @InnovateEconomy

Are Americans starting new businesses at rates well above prepandemic levels?

Core argument: One-third of the filings were "high propensity" applications under the Census Bureau's Business Formation Statistics, identifying businesses likely to hire employees if and when they become operational.

Early-stage business activity across the United States remains robust through the first half of 2023, as the pace of new business formation strengthened over last year. Individuals filed nearly 2.7 million applications to start a business between January and June of this year, a 5% increase over 2022 and a staggering 52% increase over the same period in 2019. One-third of those filings were for new businesses likely to hire employees—a key subset of applications from the Census Bureau’s Business Formation Statistics demonstrating a “high propensity” to hire staff, if and when the business becomes operational. The volume of likely employer applications also remained well above prepandemic levels, surpassing the total from the first six months of 2019 by 36%.

Takeaways by Macro Roundup® AI

  1. One-third of the filings were "high propensity" applications under the Census Bureau's Business Formation Statistics, identifying businesses likely to hire employees if and when they become operational.
  2. Likely employer applications in the first six months of 2023 exceeded the total from the same period in 2019 by 36%.

Related Articles:

  • Startup Surge Stood Firm Against Economic Headwinds in 2022 — Americans filed nearly 1.7m applications for new businesses classified by the U.S. Census Bureau as likely to hire employees, 27.8% above the pre-pandemic level and the second-highest total in the series despite being 6.5% below the prior year's record.
  • Like the Broader Economy, the High Tech Sector is Becoming Less Dynamic — The high-tech sector remains more dynamic than the rest of the economy, but the gap has faded as firm entry rates declined in both. The national firm entry rate peaked at 13.5% and the high-tech rate at 17.9%, and the gap between them narrowed from 5–6 percentage points to under one.
  • The Economics of Inequality in High-Wage Economies — United States Income, Wealth, Consumption, and Inequality Diana Furchtgott-Roth
  • Startups
  • Productivity

The Case For Continued American Equity Exceptionalism

AI Summary. Continued outperformance by US stocks is plausible because the US is positioned to capture a sizeable share of productivity gains from technologies such as artificial intelligence, while a moderating global economy would weigh on more cyclically oriented markets abroad. One study attributes 39% of 15-year equity returns to domestic economic performance.

Rebecca Patterson Financial Times
Date Posted:
August 4, 2023
Is Database:
Database

Rebecca Patterson argues US equity outperformance is likely to continue as US firms are positioned to capture a sizable share of productivity benefits from new technologies like AI, and the US is likely to experience stronger relative economic growth.

Will US stocks keep outperforming foreign markets?

Core argument: A 2011 study by Clifford Asness, Roni Israelov and John Liew suggests 39% of 15-year equity returns can be explained by domestic economic performance, consistent with the finding that domestic growth dominates local equity returns over multi-year periods.

American equity exceptionalism is possible, for at least two reasons. First, the US is set to capture a sizeable share of productivity benefits from technology such as artificial intelligence. Second, a moderating global economy could work against more cyclically biased equity markets overseas, favouring those geared towards organic growth drivers. Over multi-year periods, domestic growth has been found to dominate local equity returns. A 2011 study by Clifford Asness, Roni Israelov and John Liew suggests that 39% of 15-year returns could be explained by domestic economic performance. Growth is fundamentally a function of labour and productivity. Given that most of the developed world (and China) faces at least directionally similar labour constraints, the US seems likely to be a relative growth winner thanks to prospects for greater productivity gains.

Takeaways by Macro Roundup® AI

  1. A 2011 study by Clifford Asness, Roni Israelov and John Liew suggests 39% of 15-year equity returns can be explained by domestic economic performance, consistent with the finding that domestic growth dominates local equity returns over multi-year periods.
  2. The case for continued American equity exceptionalism rests on the US capturing a sizeable share of productivity benefits from technology such as artificial intelligence, and on a moderating global economy working against more cyclically biased overseas equity markets.
  3. With most of the developed world and China facing at least directionally similar labour constraints, the US seems likely to be a relative growth winner thanks to prospects for greater productivity gains.

Related Articles:

  • Market Resilience or Investors in Denial: The Market at Mid-Year 2023 — The S&P 500 rose 15.91% in the first half of 2023 and the tech-heavy NASDAQ returned nearly twice that, while the expected return on stocks fell from 9.82% to 8.81% and the implied equity risk premium slipped from 5.94% to 5%. The author argues that premium, roughly its average since 2008, does not signal a bubble.
  • Most Global Economies Remain in Disequilibrium, Requiring Policy Action — An investment framework holds that markets and economies are driven by three equilibriums — spending in line with output and capacity, incomes in line with debts, and normal risk premiums across assets — interacting with two policy levers, monetary and fiscal policy. When these conditions are absent, the resulting social, political, and business strains produce changes until equilibrium is restored.
  • Birth, Death, and Wealth Creation — The median age at which US companies went public rose from 7.9 years in 1976–2000 to 9.5 years in 2001–2022, implying that more wealth creation now occurs in private markets. Research on more than 28,000 US-listed companies since 1926 finds that just under 60% destroyed $9.1tn of wealth while about 2% created $50tn.
  • Growth
  • GDP

What’s the Matter With Miami?

AI Summary. A significant share of Florida's population inflow is retirees, and while the overall U.S. population grew 7.4% from 2010 to 2020, the population aged 65 and older grew 38.6%. Because retirees spend money on local services, the influx of seniors creates jobs for younger adults as well.

Paul Krugman Krugman Wonks Out
Date Posted:
August 4, 2023
Is Database:
Database

Florida’s growth relative to the population decline in Miami is driven by affordable housing and the baby boomers retiring. @paulkrugman notes that between 2010-20 the US population grew 7.4% but the share over age 65 grew 38.6%.

How does retiree migration drive local job growth?

Core argument: The U.S. population aged 65 and older grew 38.6% between 2010 and 2020, while the overall population grew 7.4%, creating a larger pool of potential retired migrants than in the past.

What are all those new Floridians doing for a living? Well, a significant number are retired. Retirees have been moving to Florida for the warm winters for a long time. But there are a lot more potential retired migrants now than in the past: between 2010 and 2020 the overall U.S. population grew only 7.4%, but the population 65 and older grew 38.6%. And since retirees spend money on local services, the influx of seniors creates jobs for younger adults as well.

Takeaways by Macro Roundup® AI

  1. The U.S. population aged 65 and older grew 38.6% between 2010 and 2020, while the overall population grew 7.4%, creating a larger pool of potential retired migrants than in the past.
  2. A significant number of Florida's new residents are retirees, continuing a long-standing pattern of migration to the state for its warm winters.
  3. Retirees moving to Florida spend money on local services, which creates jobs for younger adults as well.

In October 2022, the retired share of the American population was 1½ percentage points above its pre-pandemic trend. These 3.5 million workers account for essentially all of the shortfall in labor force participation rates., “…Despite some improvement in the labor force participation rate for the working-age population since the early stages of the pandemic, the LFPR in October 2022 remained nearly 1½ percentage points below its pre-pandemic, February 2020 level (after making adjustments for changes in population weights introduced from the 2020 Census). The importance of retirements in accounting for this shortfall is illustrated in Figure 1, which shows the percentage of the working-age population that is not in the labor force for different reasons (black line) relative to February 2020, based on responses to the Current Population Survey. While earlier in the pandemic, factors other than retirements were an important contributor to elevated non-participation (such as non-participation while caregiving, the orange line), the percent of the population that was not in the labor force and retired (the “retired share”) has steadily increased and in October 2022 was almost 1½ percentage points above its pre-pandemic level, representing an increase of more than 3½ million retirees and accounting for essentially all of the total shortfall in the LFPR….”

Brandon Adams Comment: “This is a great paper. I think the labor force participation rate could converge toward its pre-pandemic trend line faster than envisioned in this paper. The paper ignores asset markets altogether, and it seems clear to me that rapidly inflating retirement accounts in 2021 was a big part of this story. Towards the tail end of the time period covered in this paper, retirees met the unwelcome duo of rapidly decreasing asset prices and rapidly increasing consumer prices. This might or might not bring people in their 60s or 70s out of retirement, but it will almost surely slow the exit rate of those aged 40-60, and it might also bring back into the labor force some people in that age range who are currently sitting out.”

The Evidence The pre-pandemic trend, “…Even in the absence of the pandemic, the retired share would likely have risen, albeit more gradually, due to shifts in the age distribution of the population toward ages traditionally associated with higher retired shares (primarily, the movement of the Baby Boomer cohort into older ages). As one illustration of the importance of population aging, Figure 2 plots the retired share (solid line) alongside a counterfactual trend (dashed line)….”

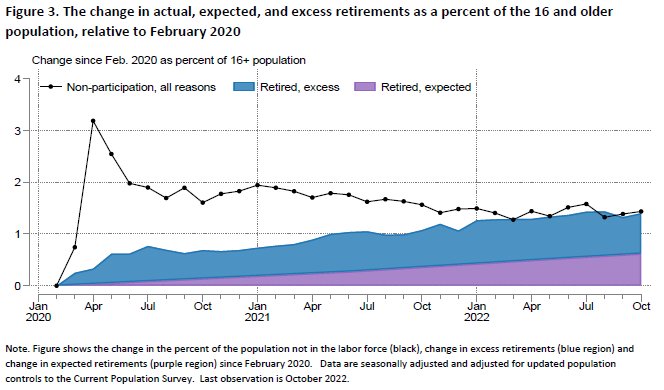
“…. This trend is an estimate of how the retired share would have evolved in the absence of the pandemic and is derived by assuming the continuation of pre-pandemic, age-specific trends in retired shares, assuming the state of the business cycle remained similar to pre-pandemic levels, and accounting for the actual changes in the age distribution over this period (in section III, we discuss in more detail the calculation of this and other counterfactual retired shares). Over the five years prior to the pandemic, the retired share increased about 0.2 percentage point per year, and plausibly would have continued increasing at a similar pace in the absence of the pandemic. As of October 2022, the retired share remained 0.6 percentage point above the pre-pandemic expected trend, or about 1.6 million people (Figure 2). This gap between the actual and expected lines is an estimate of “excess retirements,” and the excess retirements gap remains sizeable. In fact, the retired share was slightly below trend just prior to the pandemic (about 0.2 percentage point), implying that excess retirements as a share of the population have increased by about 0.8 percentage point since February 2020, or about 2.1 million people. That increase in excess retirements explains a little more than half of the 1.4 percentage point increase the total retired share since February 2020, whereas the increasing expected retired share explains the rest (see Figure 3)….”

“…Thus, less than half of the increase in the retired share to date would likely have occurred even in the absence of the pandemic, suggesting that more than half of the current LFPR shortfall is a direct result of the pandemic on retirement….First, as discussed above, more than half of the increase in the retired share relative to February 2020 is due to an increase that would have been expected in the absence of the pandemic. Second, about two-thirds of the total increase in the excess retired share is attributable to those who were age 65 and older at the start of the pandemic, with a particularly sharp increase in excess retirements among those age 70 and older. The remaining one-third of the increase in the excess retired share is attributable to those age 55 to 64 when the pandemic began. Third, there is also substantial heterogeneity across education, race, and ethnic groups, with retired shares for those age 65 and older increasing more than expected for Whites relative to Blacks and Hispanics, and for those with a college education relative to those without….…Because the retired share has remained significantly elevated since increasing substantially at the start of the pandemic and has shown little sign of converging towards its ex-pandemic counterfactual, it may take some years for retirement behavior to normalize relative to pre-pandemic norms and for the retired share of the population to converge toward what it would be in the absence of pandemic-related influences. We view it as unlikely, however, that the retired share will fall substantially towards its pre-pandemic trend and that those who retired early will return to the labor force in large numbers, since most of the excess retirements are concentrated among people who are 65 and older who (given their age) would likely be retiring in greater numbers anyway over the next few years. That assessment is supported by the stabilization of the unretirement rate at its pre-pandemic level, well below the level it would need to reach for the retired share to fall substantially…”

Joshua Montes, Christopher Smith, and Juliana Dajon, ” “The Great Retirement Boom”: The Pandemic-Era Surge in Retirements and Implications for Future Labor Force Participation,” Federal Reserve Board, November 2022, https://www.federalreserve.gov/econres/feds/the-great-retirement-boom.htm

Related Articles:

  • Miami Sees Its First Population Drop in Decades — Miami-Dade County lost 79,535 residents to net migration to other parts of Florida and other states over a recent multiyear stretch, an analysis of U.S. Census Bureau data by the Brookings Institution found, and the county's population shrank despite partial offset from foreign immigration. Miami home prices rose 53%.
  • A $100 Billion Wealth Migration Tilts US Economy’s Center of Gravity South — Six fast-growing Southern states — Florida, Texas, Georgia, North and South Carolina, and Tennessee — now contribute more to US GDP than the Northeast, including the Washington-New York-Boston corridor. The Southeast accounted for more than two-thirds of US job growth since the pandemic began, nearly double its pre-pandemic share, and housed 10 of the 15 fastest-growing large American cities.
  • Florida Ocean Temperatures At ‘Downright Shocking’ Levels — Much of Florida is recording its warmest year on record, with temperatures 3–5 degrees above normal and coastal waters in the Florida Keys reaching 92–96 degrees versus the more typical upper 80s. The National Oceanic and Atmospheric Administration reports about 40% of the world's oceans face a marine heat wave, the highest share on record.
  • Growth
  • GDP
    • Housing

Big Pharma's Big Tax Dodge

AI Summary. Six major US pharmaceutical firms reported $215bn in US sales versus $170bn abroad, yet attributed $90bn of their combined $100bn in profits to foreign operations and only $10bn to the US. That implies a 5% profit margin in the US and over 50% abroad.

Brad Setser and Tess Turner Business Insider
Date Posted:
August 4, 2023

.@Brad_Setser argues tax reform is needed as the American pharmaceutical sector has optimized its corporate structure to shift almost all of its domestic profits overseas paying an effective tax rate of 3%.

Do drug companies report most profits abroad despite higher US sales?

Core argument: Six major US pharmaceutical firms reported $90 billion of their $100 billion combined 2022 profit as earned abroad, leaving $10 billion attributed to US operations.

The six major US pharmaceutical firms that provide fairly detailed data reported making $215 billion worth of sales in the US for 2022. Given America's systematically higher prices, their sales abroad were logically more modest — totaling $170 billion. Despite this discrepancy, the companies reported earning very, very little in profits — in some cases, absolutely nothing — in the US. Of their $100 billion combined profit, the companies said $90 billion was made abroad, while a paltry $10 billion came from their US operations. That comes out to a profit margin of 5% in the US and a margin of over 50% abroad.

Takeaways by Macro Roundup® AI

  1. Six major US pharmaceutical firms reported $90 billion of their $100 billion combined 2022 profit as earned abroad, leaving $10 billion attributed to US operations.
  2. The six firms reported $215 billion in US sales against $170 billion abroad for 2022, a profit margin of 5% in the US versus over 50% abroad.
  3. Despite systematically higher US prices, the six pharmaceutical companies reported very little profit in the US, in some cases none at all.
  • Taxation
  • Fiscal Policy

Furman On Jobs Report

AI Summary. The unemployment rate fell to 3.5% and has stayed within a 3.4%–3.7% band for 17 consecutive months, while recovery in the age-adjusted participation rate has pushed the employment-population ratio for prime-age workers aged 25–54 above its pre-pandemic level. Average hourly earnings growth has picked back up from a 3.5% annual rate to about 5%.

Jason Furman @jasonfurman
Date Posted:
August 4, 2023
Is Database:
Database

While wages are still accelerating, @jasonfurman notes cooling jobs/hours and thinks today’s job report is consistent with a soft landing.

Is the labor market still tight as wage growth reaccelerates?

Core argument: Average hourly earnings growth has risen from a 3.5% annual rate earlier this year to 5%, unchanged since early 2022, reversing the earlier wage slowdown, though Furman notes these figures are noisy and subject to large revisions.

The unemployment rate fell back to 3.5%. Has been in a 3.4% to 3.7% band for 17 straight months. The last time this happened was Nov 2007. Given the recovery in the (age-adjusted) participation rate this has brought the employment-population rate for prime age workers (25-54) above the pre-pandemic rate. The wage growth slowdown earlier this year has largely gone away. Earlier this year average hourly earnings were growing at a 3.5% annual rate, now they're up to a 5% annual rate--unchanged since early 2022. Note, these are noisy and can be revised a lot. Overall this report is mixed for the inflation outlook: Jobs/hours: Cooling Unemployment rate: Neutral Wages: Heating I tend to think the order I listed them above is roughly right for what signals matter so think this report is slightly favorable for inflation.

Takeaways by Macro Roundup® AI

  1. Average hourly earnings growth has risen from a 3.5% annual rate earlier this year to 5%, unchanged since early 2022, reversing the earlier wage slowdown, though Furman notes these figures are noisy and subject to large revisions.
  2. Furman reads the report as slightly favorable for inflation, with jobs and hours cooling, the unemployment rate neutral, and wages heating, ranking those signals in that order of importance.
  • Wages/Income
  • Workforce
    • Unemployment/Participation

Monday, August 7, 2023

The Corporate Debt Maturity Wall: Implications for Capex and Employment

AI Summary. The authors estimate the average interest rate on outstanding corporate debt will rise from 4.20% to 4.50%, lifting private sector interest expense as a share of gross output by 0.25 percentage points. They project this would reduce capital spending growth by up to 0.25 percentage points and labor cost growth by up to 0.15.

Ronnie Walker and Sienna Mori Goldman Sachs
Date Posted:
August 7, 2023

.@GoldmanSachs notes the mean interest rate on corporate debt will rise from 4.2% this year to 4.5% in 2025, adding that “for each additional dollar of interest expense, firms lower their capital expenditures by 10¢ and labor costs by 20¢”

How much do rising corporate interest costs slow capex and hiring?

Core argument: The authors estimate the average interest rate on the stock of corporate debt will rise from 4.20% in 2023 to 4.30% in 2024 and 4.50% in 2025, based on their assumptions about Fed policy and market interest rates.

We estimate that the average interest rate on the current stock of corporate debt will rise from 4.20% in 2023 to 4.30% in 2024 and 4.50% in 2025, based on our assumptions about the future path of Fed policy and market interest rates. This would imply that private sector interest expense as a share of current private sector gross output will rise from 3.35% in 2023 to 3.40% in 2024 and 3.60% in 2025, an increase of 0.25pp from 2023 to 2025. The increase in interest expense that we estimate would therefore reduce capex growth by 0.10pp in 2024 and 0.25pp in 2025 and labor cost growth by 0.05pp in 2024 and 0.15pp in 2025.

Takeaways by Macro Roundup® AI

  1. The authors estimate the average interest rate on the stock of corporate debt will rise from 4.20% in 2023 to 4.30% in 2024 and 4.50% in 2025, based on their assumptions about Fed policy and market interest rates.
  2. Private sector interest expense as a share of current private sector gross output is estimated to climb from 3.35% in 2023 to 3.40% in 2024 and 3.60% in 2025, an increase of 0.25pp.
  3. The estimated rise in interest expense would reduce capex growth by 0.10pp in 2024 and 0.25pp in 2025, and labor cost growth by 0.05pp in 2024 and 0.15pp in 2025.

Related Articles:

  • Data Update 3 for 2023: Interest Rates and Bond Returns — The cost of capital for the median US company rose from 5.77% to 9.63% over a year, while the median global company's rose from 6.33% to 10.60% in US dollar terms. The cost of capital affects nearly every corporate finance decision within a business.
  • Financial Markets
  • GDP

Settling Into 4% Inflation?

AI Summary. Job churn has been declining while nominal wage growth has remained around 5% a year. Based on the historical relationship between wages, output, and prices, this implies trend nominal gross domestic product growth of roughly 5–6% a year and trend inflation of about 4% a year.

Matt Klein The Overshoot
Date Posted:
August 7, 2023

.@M_C_Klein argues income growth and credit expansion, along with quits coming down, are consistent with trend inflation of 4%, significantly above its pre-pandemic level.

Does persistent 5% wage growth imply 4% trend inflation?

Core argument: Nominal wage growth has remained stuck around 5% a year even as job churn declines.

Job churn is coming down, yet nominal wage growth has remained stubbornly stuck around 5% a year. Given the rough historical link between wages, output, and prices, the implication is that the trend growth rate of nominal gross domestic product (GDP) is now around 5-6% a year while trend inflation is around 4% a year.

Takeaways by Macro Roundup® AI

  1. Nominal wage growth has remained stuck around 5% a year even as job churn declines.
  2. Applying the rough historical link between wages, output, and prices implies trend nominal GDP growth of roughly 5–6% a year.
  3. The same link between wages and prices implies trend inflation of around 4% a year.

Related Articles:

  • What Have We Learned About the Neutral Rate? — Analysts estimate that if inflation is brought down without a recession, the Federal Reserve's policy rate will stabilize nearer 3–3.25% than the 2.5% longer-run median projection of Federal Reserve officials. Projected shifts in government debt and demographics imply a roughly 0.5 percentage point net increase in the neutral rate over the next decade.
  • The Case for “Higher for Longer”: Prices are Disinflating, But Not Wages (Yet) — Occupations with the fastest pay gains have seen wage growth normalize while pay growth elsewhere remains persistently faster, with only modest deceleration from the peak. The author argues the neutral policy rate has risen as an investment drought ends, making 5.5% short-term rates unremarkable and 4% 10-year Treasury yields potentially too low.
  • Measuring the Natural Rate of Interest After COVID-19 — Model estimates for the United States, Canada, and the Euro Area place the natural rate of interest within a few tenths of a percentage point of pre-pandemic estimates, with the main longer-term consequence of the pandemic a reduction in the natural rate of output. The authors find no evidence that the era of historically low natural rates has ended.
  • Inflation
  • GDP
  • Workforce
    • Wages/Income

The Price of Risk: With Equity Risk Premiums, Caveat Emptor!

AI Summary. Historical correlations between equity risk premiums or earnings yields and future stock returns do not translate easily into profitable market timing, because market and economic structures can shift and undercut predictions based on past data. Even when such relationships hold, statistical noise in the estimates can disrupt portfolios before predictions play out.

Aswath Damodaran Musings on Markets
Date Posted:
August 7, 2023

.@AswathDamodaran argues his implied equity risk premium for the S&P 500 of 4.44% is a better measure than alternatives for predicting future returns.

Can equity risk premiums be used to time the market profitably?

Core argument: High R-squared or correlation between equity risk premiums, earnings yields, and past returns does not translate easily into market-timing profits, because market and economic structures can shift and undercut the use of historical data for prediction.

If you are using equity risk premiums or even earnings yield for market timing, recognize that having a high R-squared or correlation in past returns will not easily translate into market-timing profits, for two reasons. First, the past is not always prologue, and market and economic structures can shift, undercutting a key basis for using historical data to make predictions. Second, even if the correlations and regressions hold, you may still find it hard to profit from them, since you (and your clients, if you are a portfolio manager) may be bankrupt, before your predictions play out. Statistical noise (the standard errors on your regression predictions) can create havoc in your portfolios, even if it eventually gets averaged out.

Takeaways by Macro Roundup® AI

  1. High R-squared or correlation between equity risk premiums, earnings yields, and past returns does not translate easily into market-timing profits, because market and economic structures can shift and undercut the use of historical data for prediction.
  2. Even when correlations and regressions hold, investors and portfolio managers may go bankrupt before their market-timing predictions play out.
  3. Statistical noise, reflected in the standard errors on regression predictions, can create havoc in portfolios even if that noise eventually averages out.

Related Articles:

  • The Benefit of Owning Stocks Over Bonds Keeps Shrinking — The gap between the S&P 500's expected earnings yield and the 10-year U.S. government bond yield has narrowed to about 1.1 percentage points, its smallest since 2002. Measured against the 10-year inflation-protected Treasury yield, the spread is about 3.5 percentage points, the lowest since 2003.
  • The Rasputin Effect: Global Resilience To Higher Rates — The US corporate sector's financial balance remains in surplus, a condition that has never preceded a recession, and central banks have withdrawn only about one third of the $11tn in global liquidity they created. Excess US household savings are projected to run out in the following year, pointing to modestly weaker conditions rather than a significant contraction.
  • Most Global Economies Remain in Disequilibrium, Requiring Policy Action — An investment framework holds that markets and economies are driven by three equilibriums — spending in line with output and capacity, incomes in line with debts, and normal risk premiums across assets — interacting with two policy levers, monetary and fiscal policy. When these conditions are absent, the resulting social, political, and business strains produce changes until equilibrium is restored.
  • Financial Markets
  • GDP

Will Today’s Behemoths Rule Tomorrow?

AI Summary. From 1994 to 2013, an annually rebalanced portfolio of the 5 largest US stocks returned about the same as the entire S&P 500, with both trailing a large-cap value portfolio; only in the last decade have returns concentrated in a few technology companies. The authors argue tomorrow's largest companies may differ, favoring diversification.

Chris Satterthwaite Verdad
Date Posted:
August 7, 2023

Chris Satterthwaite notes the overperformance of the top-5 market cap stocks is historically unusual and speculates that technological advances ranging from AI and superconductors will likely drive significant churn over the next decade.

Do the largest stocks reliably deliver the best long-run returns?

Core argument: From 1994 to 2013, an annually rebalanced portfolio of the largest 5 US stocks returned about the same as the entire S&P 500, while both significantly lagged a large-cap value portfolio per Ken French data.

The phenomenon of the largest stocks delivering the best returns is new, in our opinion. In fact, from 1994 to 2013, an annually rebalanced portfolio of the largest 5 stocks (“Big 5”) in the US had a comparable return to the entire S&P 500. But both portfolios significantly lagged a large-cap value portfolio (per Ken French). The last 10 years have seen a concentration of returns to the tech sector and to a few companies within that sector. This is both notable and unusual. With the advent of exciting new technologies like AI and superconductors, we think it’s plausible that the top 5 largest companies 10 years from now may look quite different from the top 5 today. In which case, a diversified portfolio would likely serve investors better than a highly concentrated size-defined portfolio.

Takeaways by Macro Roundup® AI

  1. From 1994 to 2013, an annually rebalanced portfolio of the largest 5 US stocks returned about the same as the entire S&P 500, while both significantly lagged a large-cap value portfolio per Ken French data.
  2. The authors characterize the concentration of returns into the tech sector and a few companies within it over the past decade as notable and unusual, arguing that the largest stocks delivering the best returns is a new phenomenon.
  3. The authors argue that with technologies such as AI and superconductors emerging, the top 5 largest companies 10 years from now may look quite different from today's, favoring a diversified portfolio over a concentrated size-defined one.

Related Articles:

  • Birth, Death, and Wealth Creation — The median age at which US companies went public rose from 7.9 years in 1976–2000 to 9.5 years in 2001–2022, implying that more wealth creation now occurs in private markets. Research on more than 28,000 US-listed companies since 1926 finds that just under 60% destroyed $9.1tn of wealth while about 2% created $50tn.
  • Mr. Toad’s Wild Ride: The Impact Of Underperforming 2020 and 2021 US IPOs — Between 40% and 60% of US initial public offerings generate negative returns even in favorable periods, so average IPO returns far exceed median returns and depend on a small set of large winners. Excluding just the top 3% of IPOs turns average net returns negative and cuts average absolute returns by more than half.
  • The Economics of Inequality in High-Wage Economies — United States Income, Wealth, Consumption, and Inequality Diana Furchtgott-Roth
  • Financial Markets
  • GDP

Is a U.S. Debt Crisis Looming? Is it Even Possible?

AI Summary. A debt spiral requires the interest rate on government debt to exceed the economy's growth rate; with inflation-protected 10-year U.S. bond yields near 1.83%, close to most estimates of sustainable growth, any spiral would be slow-moving. Stabilizing debt at 100% of GDP would require a 2% primary surplus.

Paul Krugman Krugman Wonks Out
Date Posted:
August 7, 2023
Is Database:
Database

.@paulkrugman argues that at the current interest rate of inflation-protected 10-year U.S. bonds of 1.83%, economic growth makes a runaway debt spiral unlikely.

Do current interest rates make a fast US debt spiral likely?

Core argument: The inflation-protected 10-year U.S. Treasury yield stood at 1.83%, close to most estimates of the economy's sustainable growth rate.

You can get a debt spiral if r is significantly larger than g; in that case rising debt leads to faster accumulation of debt, and we’re off to the races. Even after the rate surge of the past few days, the interest rate on inflation-protected 10-year U.S. bonds was 1.83%, which is close to most estimates of the economy’s sustainable growth rate. If you take the low end of such estimates, we could possibly face a debt spiral, but it would be a very slow-motion spiral. Put it this way: If r is 1.8, while g is only 1.6, stabilizing the debt ratio with debt at 100% of G.D.P. would require a primary surplus of 2% of G.D.P.; increase debt to 150%, and that required surplus would increase only to 3%.

Takeaways by Macro Roundup® AI

  1. The inflation-protected 10-year U.S. Treasury yield stood at 1.83%, close to most estimates of the economy's sustainable growth rate.
  2. A debt spiral requires the interest rate r to be significantly larger than the growth rate g, in which case rising debt accelerates further debt accumulation.
  3. With r at 1.8% and g at 1.6%, stabilizing the debt ratio at 100% of G.D.P. would require a primary surplus of 2% of G.D.P., rising only to 3% at 150% of G.D.P.

Related Articles:

  • Summers and Blanchard Debate the Future of Interest Rates — With expected inflation near 2.5%, a real interest rate of 1.5% to 2%, and some risk and term premium, short-term interest rates would average around 4%, one argument in a debate on the future of interest rates holds. If traditional spreads reassert themselves, longer-term rates would run about 1 percentage point higher, near 5%.
  • Interest Costs Will Grow the Fastest Over the Next 30 Years — The Congressional Budget Office projects federal spending will reach 29.1% of GDP over three decades, with net interest on the national debt rising from 1.9% of GDP to 6.7%, or $5.4tn. Under that projection, interest becomes the largest single federal budget line item, surpassing Social Security, Medicare, and Medicaid.
  • US Fiscal Alarm Bells Are Drowning Out a Deeper Problem — The Congressional Budget Office projects US federal debt held by the public at 98% of national income, within 7.6 percentage points of its 1946 wartime peak and on track to exceed it by 2028. International Monetary Fund forecasts show US debt surpassing Italy's by 2028 and Greece's by the end of the decade.
  • Fiscal Deficits
  • Fiscal Policy

Rangvid On Housing Inflation

AI Summary. US core inflation measures include the cost of owner-occupied housing by imputing what homeowners would pay to rent from themselves, while Europe's core measure leaves owner-occupied housing out entirely. Measured the European way, US inflation is already back to 2%, while European inflation remains well above target.

John Cochrane The Grumpy Economist
Date Posted:
August 7, 2023

.@JohnHCochrane notes that excluding the cost of housing, US inflation is already back at target, consistent with the fiscal theory of the price level.

Does excluding owner-occupied housing put US inflation back at 2%?

Core argument: Measured the way Europe's HICP core does it, excluding owner-occupied housing altogether, US inflation is already back to 2%, according to Jesper Rangvid.

CPI and PCE core inflation (orange and gray) are how the US calculates inflation less food and energy, but including housing. We do an economically sophisticated measure that tries to measure the "cost of housing" by rents for those who rent, plus how much a homeowner pays by "renting" the house to him or herself. You can quickly come up with the plus and minus of that approach, especially for looking at month to month trends in inflation. Europe in the "HICP core" line doesn't even try and leaves owner occupied housing out altogether. Jesper's point: if you measure inflation Europe's way, US inflation is already back to 2%. The Fed can hang out a "mission accomplished" banner. (Or, in my view, an "it went away before we really had to do anything serious about it" banner.) And, since he writes to a European audience, Europe has a long way to go.

Takeaways by Macro Roundup® AI

  1. Measured the way Europe's HICP core does it, excluding owner-occupied housing altogether, US inflation is already back to 2%, according to Jesper Rangvid.
  2. US CPI and PCE core inflation exclude food and energy but include housing, measuring rents paid by renters plus an imputed rent homeowners are treated as paying themselves.
  3. Rangvid argues that by the same HICP core standard that puts US inflation at 2%, European inflation still has a long way to go.

Related Articles:

  • Striking Similarities (and Differences) Between Inflation Today and In the 1970s — US inflation over the past 5-10 years has closely tracked its behavior in the early 1970s, a pattern that would put inflation back on target by mid-2024. But unlike the early 1970s, when core inflation followed headline inflation both up and down, headline inflation has been falling while core has not, indicating more pronounced underlying inflationary pressures.
  • Inflation
  • GDP

Can Measurement Error Explain Slow Productivity Growth in Construction?

AI Summary. The authors estimate that measurement error has biased construction-sector productivity growth downward by at most 0.75pp a year, raising average growth from -0.5% to 0.2%. Even adjusted, construction productivity growth remains about 1pp below the next-lowest major industry and more than 1.5pp below the nonfarm business sector.

Daniel Garcia and Raven Molloy Federal Reserve Board
Date Posted:
August 7, 2023

A @FederalReserve working paper argues that the decline in construction productivity is largely a mismeasurement issue and the sector’s productivity was “essentially flat” between 1987 and 2019.

Does measurement error explain weak construction productivity growth?

Core argument: The authors estimate mismeasurement has biased construction-sector productivity growth downward by at most 0.75pp per year, raising average 1987–2019 growth from -0.5% to +0.2%.

We find that mismeasurement error has biased construction-sector productivity growth downward by 3⁄4pp per year at the very most. This brings an estimate of average productivity growth from 1987 to 2019 up to positive territory, but just barely (from negative 0.5% to positive 0.2%), and still about 1pp below productivity growth of the next-lowest major industries and more than 11⁄2pp below the average for the nonfarm business sector. Consequently, we conclude that productivity growth may well have been quite low in the construction industry, even if it has not been as low as implied by the official statistics. While this estimated growth rate is higher than the growth rate of the published data, it does not change the qualitative result that productivity growth in this sector has been quite low. And our estimate of productivity growth in the construction sector remains much lower than in other industries.

Takeaways by Macro Roundup® AI

  1. The authors estimate mismeasurement has biased construction-sector productivity growth downward by at most 0.75pp per year, raising average 1987–2019 growth from -0.5% to +0.2%.
  2. Even after correcting for measurement error, the authors find construction productivity growth remains about 1pp below the next-lowest major industries and more than 1.5pp below the nonfarm business sector average.
  3. The authors conclude that productivity growth in construction may well have been quite low, even if not as low as official statistics imply.

Related Articles:

  • The Strange and Awful Path of Productivity in the U.S. Construction Sector — U.S. construction sector labor productivity and total factor productivity grew faster than the whole economy in the 1950s and 1960s, then fell, ending 2020 below their 1950 levels while economywide labor productivity and total factor productivity were 290% and 230% higher. Construction labor productivity fell about 1% a year from 1970 to 2020.
  • Construction Industry Has Work, Needs More Workers — U.S. nonresidential construction spending reached $982bn, nearly 17% higher than a year earlier, while nonresidential construction employment rose 3.3%, or 149,100 workers. Contractors are ramping up hiring of entry-level laborers to compensate for shortages of other workers, and these less productive hires are contributing to bigger backlogs and longer job completion times.
  • Investment
  • GDP
    • Housing
  • Productivity

US Scientists Repeat Fusion Power Breakthrough

AI Summary. Scientists at the Lawrence Livermore National Laboratory achieved net energy gain in a fusion reaction for a second time, with preliminary results indicating the experiment produced a higher energy output than the first ignition.

Tom Wilson and Alice Hancock Financial Times
Date Posted:
August 7, 2023

American scientists at Lawrence Livermore National Laboratory have repeated their achievement of net energy gain in a fusion reaction.

Can scientists reliably repeat net energy gain from fusion?

Core argument: Scientists at the Lawrence Livermore National Laboratory achieved net energy gain in a fusion reaction for the second time in a July 30 experiment, producing a higher energy output than the December ignition result, according to three people with knowledge of the preliminary results.

US government scientists have achieved net energy gain in a fusion reaction for the second time. Researchers at the federal Lawrence Livermore National Laboratory in California, who achieved ignition for the first time last year, repeated the breakthrough in an experiment on July 30 that produced a higher energy output than in December, according to three people with knowledge of the preliminary results. The improved result at NIF, coming “only eight months” after the initial breakthrough, was a further sign that the pace of progress was increasing, said one of the people with knowledge of the results.

Takeaways by Macro Roundup® AI

  1. Scientists at the Lawrence Livermore National Laboratory achieved net energy gain in a fusion reaction for the second time in a July 30 experiment, producing a higher energy output than the December ignition result, according to three people with knowledge of the preliminary results.
  2. The repeat ignition at the National Ignition Facility came eight months after the first breakthrough, which one person with knowledge of the results said was a further sign that the pace of progress was increasing.

Related Articles:

  • How US Scientists Moved One Step Closer to Dream of Fusion Power — A US fusion experiment produced about 3.15 megajoules of energy from 2.05 megajoules delivered by its lasers, achieving energy gain long seen as a key step toward commercial fusion power. That comparison excludes the 330 megajoules of electricity drawn to power each shot, and scientists estimate commercial fusion requires reactions yielding 30x to 100x the energy put in.
  • When Will Fusion Be Ready for Prime Time? Watch These Three Numbers — Fusion progress is tracked by Q, the ratio of energy released to energy used: one experiment delivered 3.15 megajoules from 2.05 megajoules of laser energy, a Q of about 1.5, but the full reactor consumed roughly 300 megajoules, putting whole-system Q near 0.01, about 1% of break-even.
  • Tech Billionaires Bet on Fusion as Holy Grail for Business — Private fusion companies have raised more than $5bn, with seven firms raising at least $200m each, and roughly 75% of that fundraising occurring since 2021. Improvements in large-scale machine learning have sped up experiments and helped several companies reach or approach the extreme temperatures and pressures fusion reactions require.
  • Innovation/Research
  • Energy
  • Productivity
    • Investment

Mainland China Airs Documentary Signalling Military Preparation For Taiwan Attack And Willingness To Sacrifice

AI Summary. China's state broadcaster aired an eight-episode documentary series, Zhu Meng ("chasing dreams"), showing People's Liberation Army personnel pledging readiness to fight "at any second" and to sacrifice themselves, including a stealth fighter pilot vowing to launch a suicide attack if necessary. The series signals Beijing's preparation for an attack on Taiwan.

Liu Zhen South China Morning Post
Date Posted:
August 7, 2023

.@SCMPNews reports Chinese state media is airing a high-profile documentary that highlights the PLA’s willingness to fight and die in pursuit of “reunification.”

.@SCMPNews reports Chinese state media is airing a high-profile documentary that highlights the PLA’s willingness to fight...

Is China signaling military readiness to attack Taiwan through state television?

Core argument: China's state broadcaster CCTV aired the eight-episode documentary series Zhu Meng ("chasing dreams") to mark the People's Liberation Army's 96th anniversary, portraying military personnel as ready to fight "at any second.".

Beijing is trying to send strong signals about its preparation for an attack on Taiwan, with People’s Liberation Army soldiers pledging to sacrifice themselves. The pledges are part of the eight-episode documentary series Zhu Meng, or “chasing dreams”, aired on state broadcaster CCTV from Tuesday to mark the PLA’s 96th anniversary and show the readiness of military personnel to fight “at any second”. In one instance, a pilot in one of the PLA’s most advanced stealth fighter jets vows to launch a suicide attack if necessary.

Takeaways by Macro Roundup® AI

  1. China's state broadcaster CCTV aired the eight-episode documentary series Zhu Meng ("chasing dreams") to mark the People's Liberation Army's 96th anniversary, portraying military personnel as ready to fight "at any second.".
  2. PLA soldiers pledge in Zhu Meng to sacrifice themselves, with a pilot of one of the PLA's most advanced stealth fighter jets vowing to launch a suicide attack if necessary.
  3. Beijing is seeking to send strong signals through the series about its preparation for an attack on Taiwan.
  • China
  • Security


Loading More Posts

End of content

No more pages to load

© Copyright 2026 Coherent Research Institute · All Rights Reserved · Privacy · Terms