Edward Conard

Top Ten New York Times Bestselling Author

  • “Unintended Consequences should be read by anyone who takes for granted the superiority of progressive taxation and has not thought carefully about the trade-offs involved.” - The New Republic
  • “…a very valuable contribution.” - Larry Summers, former Secretary of the Treasury and director of the National Economic Council, president emeritus, Harvard University
  • “…reminds us that inequality sends a signal of what society lacks most, in America’s case, entrepreneurship and risk taking.” - Lawrence Lindsey, CEO, The Lindsey Group, former Director of the National Economic Council
  • “…challenges misconceptions that distort our economic debates.” - Arthur Brooks, President of the American Enterprise Institute
  • “Unintended Consequences is full of substance, it is one of the must-read books of the year, and once I finish it I will be giving it a second read through right away.” - Tyler Cowen, Professor, George Mason University
  • “…a comprehensive explanation of the modern economy.” - Julian Robertson, Founder, Tiger Management
  • “A full-throated defense of economic dynamism.” - The Wall Street Journal
  • “Unintended Consequences is far smarter and more thought-provoking than most economics written for the general public” - Greg Mankiw, Harvard University, Former Chairman of the Council of Economic Advisors
  • “Unintended Consequences represents the most cogent and persuasive analysis of the Financial Crisis to date.” - Andrei Shleifer, 1999 John Bates Clark Medal Winner
  • “…serious thinking for serious thinkers. …a thought-provoking blueprint for growing middle- and working-class incomes.” - Mitt Romney, former Governor of Massachusetts
  • “Unintended Consequences provides a provocative interpretation of the causes of the global financial crisis and the policies needed to return to rapid growth. Whether you agree or not, this analysis is well worth reading.” - Nouriel Roubini, New York University; Chairman, Roubini Global Economics
  • “…a very valuable contribution.” - Larry Summers, former Secretary of the Treasury and director of the National Economic Council, president emeritus, Harvard University
Upside of Inequality Oxford Unintended Consequences
Buy the Books
  • Macro Roundup
  • About Roundup
  • About Ed Conard
  • Highlights
  • Topics
  • Subscribe
Edward Conard
  • twitter
  • facebook
  • linkedin
  • youtube

Macro Roundup

  • Email
  • Text Message (SMS)
  • Twitter/X
  • LinkedIn
  • Facebook
  • WhatsApp Message
Subscribe to Macro Roundup Emails
Select topics to choose: articles that mention them (broader) or articles mainly about them (focused)
  • Mentions 0
  • Primary focus 0
Showing all 7,336 Macro Roundup articles
When you search for any topic (like GDP, Inflation, or Banking), choose:
Choose search scope

Friday, February 24, 2023

Fed’s Preferred Inflation Gauge Accelerates, Adding Pressure for More Rate Hikes

AI Summary. The Federal Reserve's preferred inflation gauge accelerated, with the personal consumption expenditures price index up 5.4% from a year earlier and the core measure up 4.7%, both pickups after several months of declines. Inflation-adjusted consumer spending jumped 1.1% from the prior month, the most in nearly two years, after consecutive declines.

Reade Pickert Bloomberg
Date Posted:
February 24, 2023

Core-PCE rose to 4.7% y/y up from 4.6% in December. Consumer spending rose just over 1% from the prior month, the most in two years. @markets

Is inflation reaccelerating alongside a rebound in consumer spending?

Core argument: The personal consumption expenditures price index rose 5.4% from a year earlier in January and the core measure rose 4.7%, both accelerating after several months of declines.

The Federal Reserve’s preferred inflation gauges unexpectedly accelerated in January and consumer spending surged after a year-end slump, adding pressure on policymakers to keep ratcheting up interest rates. The personal consumption expenditures price index rose 5.4% from a year earlier and the core metric was up 4.7%, both marking pickups after several months of declines. Consumer spending, adjusted for prices, jumped 1.1% from the prior month, the most in nearly two years, after consecutive declines.

Takeaways by Macro Roundup® AI

  1. The personal consumption expenditures price index rose 5.4% from a year earlier in January and the core measure rose 4.7%, both accelerating after several months of declines.
  2. Inflation-adjusted consumer spending jumped 1.1% from the prior month in January, the largest gain in nearly two years, following consecutive monthly declines.
  3. The unexpected pickup in the Federal Reserve's preferred inflation gauges, alongside surging consumer spending, adds pressure on policymakers to keep raising interest rates.
  • Inflation
  • GDP

Jason Furman On PCE Release

AI Summary. Core personal consumption inflation is running at 4.7% over 12 months with little progress, and the economy is described as very overheated. Inflation is more likely than not to fall from that pace, but a tight labor market and goods prices make 6% inflation much more likely than 2%.

Jason Furman @jasonfurman
Date Posted:
February 24, 2023

.@jasonfurman thinks that the tight labor market means that “6% inflation is much more likely than 2% inflation,” and concludes, “If I were the FOMC I would be raising rates by 50bp at the next meeting and signaling a terminal rate around 6%.”

Is high inflation more likely than a return to 2%?

Core argument: Jason Furman notes core PCE inflation at annual rates of 7.1% over one month, 4.7% over three months, 5.1% over six months, and 4.7% over twelve months, indicating little if any progress on inflation.

The economy is very overheated. We have made little if any progress on inflation. There is little if any reason to expect a large slowdown going forward. Core PCE at an annual rate: 1 month: 7.1% 3 months: 4.7% 6 months: 5.1% 12 months: 4.7%. In some ways it is cleaner just to exclude housing and used cars. Which gives [approximately] the same story as core inflation. We still have lagged rent but that is probably only worth about 0.5 to 1pp off the rate. Possibly lagged monetary policy effects coming too. So yes, more likely than not that inflation falls from its 4.7% pace. Maybe even into the 3's. But there are still forces going in the direction of high inflation. In recent months goods prices have fallen, but that likely won't continue. And the extremely tight labor market has lagged effects on inflation. 6% inflation is much more likely than 2% inflation. If I were the FOMC I would be raising rates by 50bp at the next meeting and signaling a terminal rate around 6%.

Takeaways by Macro Roundup® AI

  1. Jason Furman notes core PCE inflation at annual rates of 7.1% over one month, 4.7% over three months, 5.1% over six months, and 4.7% over twelve months, indicating little if any progress on inflation.
  2. Furman argues the economy is very overheated and that 6% inflation is much more likely than 2%, with recent goods-price declines unlikely to continue and the extremely tight labor market carrying lagged effects on inflation.
  3. Furman says that were he on the FOMC he would raise rates by 50bp at the next meeting and signal a terminal rate around 6%, while granting inflation more likely than not falls from its 4.7% pace, maybe into the 3's.
  • Inflation
  • GDP
  • Monetary Policy

Private Debt, Monetary Policy Tightening and Aggregate Demand

AI Summary. High private debt relative to GDP may make aggregate demand more sensitive to interest rate increases, but longer debt maturities, less prevalent variable-rate borrowing, and higher household net worth should counteract that sensitivity. Both the level and composition of private debt matter for calibrating monetary policy.

Miguel Ampudia, Fiorella De Fiore, et al Bank for International Settlements
Date Posted:
February 24, 2023

.@BIS_org argues aggregate global demand might be more sensitive to higher rates given elevated debt levels.

Does high private debt make demand more sensitive to rate hikes?

Core argument: Private debt levels stand at historical highs as monetary policy tightens globally, and when private debt to GDP is high, aggregate demand may be more sensitive to interest rate hikes.

Monetary policy is tightening globally while private debt levels stand at historical highs. When private debt to GDP is high, aggregate demand may be more sensitive to interest rate hikes. Yet, after a decade of low rates, the maturity of private debt has generally lengthened, the prevalence of variable rates has fallen, and household net worth has increased. This should counteract the higher demand sensitivity stemming from elevated debt. Both the level and composition of private debt are important factors, although not the only ones, for the calibration of monetary policy in the current economic environment.

Takeaways by Macro Roundup® AI

  1. Private debt levels stand at historical highs as monetary policy tightens globally, and when private debt to GDP is high, aggregate demand may be more sensitive to interest rate hikes.
  2. After a decade of low rates, lengthened private debt maturities, a reduced prevalence of variable rates, and higher household net worth should counteract the greater demand sensitivity stemming from elevated debt.
  3. Both the level and composition of private debt are important factors, though not the only ones, for calibrating monetary policy.
  • Inflation
  • GDP
  • Monetary Policy

New York’s Millionaire Exodus

AI Summary. New York's count of tax filers with adjusted gross income above $1m fell 1.3%, from 55,100 to 54,370, while the national total rose nearly 10% to 608,549. The state's top 1% of earners supply close to half of its income tax revenue.

Paul Farrell Daily Mail
Date Posted:
February 24, 2023
Is Database:
Database

.@DailyMail reports that 8% of very wealthy New Yorkers (those earning >$25 million per year) left the state during 2021.

Is New York losing millionaires while their numbers rise nationally?

Core argument: New York saw 1,453 residents earning more than $25 million leave the state in 2021, only 520 fewer than departed at the height of lockdowns, implying 17% of this cohort over two years.

The number of those earning more than $25 million that fled the state in 2021 is 1,453, just 520 less than the amount that left at the height of lockdowns and intense social distancing [implying 17% of this cohort over two years]. The top one percent of earners in New York account for close to half of the state's income tax revenue. Between 2019 and 2020, New York City lost six percent of those earning between $150,000 and $750,000.  EJ McMahon of the Empire Center for Public Policy claimed the data showed a 1.3 percent decline in the number of New Yorkers with adjusted gross annual income of more than $1 million. The precise figure fell from 55,100 to 54,370 - 730 individuals, while the national number climbed from 554,340 to 608,549 - a nearly 10 percent jump.  According to new Census Bureau data, New York experienced the largest population decline of any US state this year - losing 0.9 percent of its residents.

Takeaways by Macro Roundup® AI

  1. New York saw 1,453 residents earning more than $25 million leave the state in 2021, only 520 fewer than departed at the height of lockdowns, implying 17% of this cohort over two years.
  2. EJ McMahon of the Empire Center for Public Policy said the data showed New Yorkers with adjusted gross income above $1 million fell 1.3% from 55,100 to 54,370, while the national count rose nearly 10% from 554,340 to 608,549.
  3. New York's top 1% of earners account for close to half of the state's income tax revenue, and New York City lost 6% of residents earning $150,000–$750,000 between 2019 and 2020.
  • Taxation

America’s Obsession with Big Cars Has Fatal Consequences

AI Summary. 43,000 people died on US roads in 2021, the highest mortality rate in the developed world, with the average new American car weighing 1.94 tons, half a ton more than the European average. As vehicles grew heavier, occupant deaths fell 22% while pedestrian deaths rose 57%.

John Burn-Murdoch Financial Times
Date Posted:
February 24, 2023

Pedestrians’ deaths in America have risen 57%, in part because Americans prefer larger cars (fully half a ton larger than the European average). @jburnmurdoch

Do heavier American cars raise pedestrian deaths while protecting occupants?

Core argument: 43,000 people died on US roads in 2021, the highest road mortality rate in the developed world by some margin.

43,000 people died on America’s roads in 2021, the highest mortality rate in the developed world by some margin. The average new American car purchased in 2021 weighed 1.94 tons, fully half a ton more than the European average. Purchases of SUVs and “light” trucks together now account for four out of every five new vehicles bought in the US, up from one in five 50 years ago. This would all be a mere curiosity except that these vehicles have a variety of lethal qualities. As American cars have bulked up, the number of fatalities for the drivers and passengers inside these rolling fortresses has fallen by 22 per cent. But the number of pedestrians killed has risen by 57 per cent. According to an estimate by Justin Tyndall, assistant professor of economics at the University of Hawaii, the lives of 8,000 pedestrians could have been saved between 2000 and 2018 if Americans had stuck to smaller vehicles.

Takeaways by Macro Roundup® AI

  1. 43,000 people died on US roads in 2021, the highest road mortality rate in the developed world by some margin.
  2. As American cars have grown heavier, fatalities among drivers and passengers inside them have fallen 22 per cent while pedestrian deaths have risen 57 per cent.
  3. Justin Tyndall, assistant professor of economics at the University of Hawaii, estimates that 8,000 pedestrian lives could have been saved between 2000 and 2018 had Americans stuck to smaller vehicles.
  • Poverty/Crime
  • Workforce

The Slow Diffusion of Earnings Inequality

AI Summary. Earnings inequality between firms declines as a group of firms founded in the same year ages, while each successive founding cohort enters with higher between-firm pay dispersion, a pattern that accounts for a large share of the aggregate rise in between-firm earnings inequality. The authors expect inequality to keep rising as older cohorts are replaced by newer ones.

Isaac Sorkin and Melanie Wallskog National Bureau of Economic Research
Date Posted:
February 24, 2023
Is Database:
Database

A new @NBERpubs paper shows that newer firms have more earnings dispersion than older firms, and that this pattern accounts for a large fraction of the aggregate rise in between-firm earnings inequality. @WallskogMelanie

Do newer firm cohorts drive the rise in between-firm earnings inequality?

Core argument: Between-firm earnings inequality within a firm cohort declines as that cohort ages, while each subsequent cohort enters with higher between-firm dispersion and then declines along a path roughly parallel to earlier cohorts.

We plot the between-firm variance of earnings within a cohort over time. We find two striking patterns. First, within a cohort, between-firm earnings inequality declines as the cohort ages. Second, each subsequent cohort of firms enters with a higher level of between-firm earnings inequality before declining on a path approximately parallel to previous cohorts. We find that between-firm pay dispersion declines within a cohort. Second, there are striking cohort patterns: more recent cohorts are more dispersed than older cohorts. This pattern accounts for a large fraction of the aggregate rise in between-firm earnings inequality. As older cohorts are replaced with cohorts with inequality “technology” of the more recent vintage, we expect inequality to continue to rise, even without a change in that underlying technology.

Takeaways by Macro Roundup® AI

  1. Between-firm earnings inequality within a firm cohort declines as that cohort ages, while each subsequent cohort enters with higher between-firm dispersion and then declines along a path roughly parallel to earlier cohorts.
  2. The cohort pattern in between-firm pay dispersion accounts for a large fraction of the aggregate rise in between-firm earnings inequality.
  3. As older cohorts are replaced by cohorts carrying more recent inequality "technology," between-firm earnings inequality is expected to keep rising even without any change in that underlying technology.
  • High vs Low Skill
  • Productivity
    • Workforce Reorganization
  • Workforce
    • Inequality

The worlds interest bill is 13trnand rising

AI Summary. An analysis of 58 countries representing 90% of global GDP finds total interest costs rose from $10.4tn (12% of GDP) to $13tn (14.5% of GDP), and projects they could reach 17% of GDP if current rate trajectories persist. Total debt in these countries stands at $298tn, or 342% of GDP.

Economist Staff The Economist
Date Posted:
February 24, 2023
Is Database:
Database

Total interest costs for 90% of global economy could rise from 12% of GDP in 2021 to 17% by 2027 if current rate trajectories persist.

How much of global GDP goes to paying interest?

Core argument: Across 58 countries representing 90% of global GDP, the total interest bill rose from $10.4tn, or 12% of GDP, in 2021 to $13tn, or 14.5% of GDP, in 2022, and could reach 17% by 2027 if current rate trajectories persist.

An analysis covering 58 countries, representing 90% of global GDP, indicates that total interest costs could rise from 12% of GDP in 2021 to 17% by 2027 if current rate trajectories persist. In 2021, the interest bill was $10.4tn, or 12% of GDP, increasing to $13tn, or 14.5% of GDP, by 2022. This rise is driven by policy rates jumping from an average of 2.6% in early 2021 to 7.1% by late 2022. Total debt in these countries stands at $298tn, or 342% of GDP, up from $255tn pre-pandemic. Higher rates could push the interest burden to 20% of GDP if underestimated by markets. Inflation may ease some burdens by boosting nominal incomes, but the significant rate hikes have largely offset this relief. The impact varies across industries and countries, with some facing severe fiscal challenges.

Takeaways by Macro Roundup® AI

  1. Across 58 countries representing 90% of global GDP, the total interest bill rose from $10.4tn, or 12% of GDP, in 2021 to $13tn, or 14.5% of GDP, in 2022, and could reach 17% by 2027 if current rate trajectories persist.
  2. Average policy rates across the 58 countries jumped from 2.6% in early 2021 to 7.1% by late 2022, and the interest burden could reach 20% of GDP if markets have underestimated rates.
  3. Total debt across the 58 countries stands at $298tn, or 342% of GDP, up from $255tn before the pandemic, with the burden varying across industries and countries.

An Economist analysis suggests that if rates follow their current trajectory, total interest costs globally will rise from 12% of GDP in 2021 to 17% by 2027. Their analysis covered 58 countries representing 90% of global GDP, “…. The Economist has estimated the interest bill for companies, households and governments across 58 countries. Together these economies account for more than 90% of global GDP. In 2021 their interest bill stood at $10.4T, or 12% of combined GDP. By 2022 it had reached a whopping $13T, or 14.5% of GDP. Our analysis suggests that, if rates follow the path priced into government-bond markets, the interest tab will hit around 17% of GDP by 2027.Interest costs in America exceeded 20% of GDP during the global financial crisis of 2007-09, the economic boom of the late 1990s and the last proper burst of inflation in the 1980s. Yet an average bill of this size would mask big differences between industries and countries….”

Economist Staff, "The world’s interest bill is $13trn—and rising,"The Economist, February 19, 2023, https://www.economist.com/finance-and-economics/2023/02/19/the-worlds-13trn-interest-bill

The world’s interest bill is $13trn—and rising

After a relaxing 2010s, in which interest rates hardly budged, rising prices are putting central-bank officials to work. Indeed, policymakers have rarely been busier. In the first quarter of 2021, policy rates in a sample of 58 rich and emerging economies languished at an average of 2.6%. By the final quarter of 2022, this figure had jumped to 7.1%. Meanwhile, total debt in these countries stands at $298trn, or 342% of their combined gdp, up from $255trn, or 320% of gdp, before the covid-19 pandemic.

The more indebted the world becomes, the more sensitive it is to interest-rate rises. To assess the effect of borrowing and higher rates, The Economist has estimated the interest bill for companies, households and governments across 58 countries. Together these economies account for more than 90% of global gdp. In 2021 their interest bill stood at a $10.4trn, or 12% of combined gdp. By 2022 it had reached a whopping $13trn, or 14.5% of gdp.

Our calculations make a series of assumptions. In the real world, higher interest rates do not push up debt-servicing costs immediately, except for those of floating-rate debt, such as many overnight bank loans. The maturity of government debt tends to be in the range of five to ten years; companies and households tend to borrow on a shorter-term basis. Therefore we assume that interest-rate rises feed through over the course of five years for public debt, and over a two-year period for households and companies.

To project what might happen over the next few years, we make a few more assumptions. Real-life borrowers respond to higher rates by reducing debt to ensure that interest payments do not get out of hand. Nonetheless, research by the Bank for International Settlements, a club of central banks, shows that higher rates do raise interest payments on debt relative to income—ie, that deleveraging does not entirely negate higher costs. Thus we assume that nominal incomes rise according to imf forecasts and debt-to-gdp ratios stay flat. This implies annual budget deficits of 5% of gdp, lower than before covid.

Our analysis suggests that, if rates follow the path priced into government-bond markets, the interest tab will hit around 17% of gdp by 2027. What if markets are underestimating how much tightening central banks have in store? We find that another percentage point, on top of that which markets have priced in, would bring the bill to a mighty 20% of gdp.

The worlds interest bill is 13trnand rising: Extended Excerpt Image 1


Such a bill would be big, but not without precedent. Interest costs in America exceeded 20% of gdp during the global financial crisis of 2007-09, the economic boom of the late 1990s and the last proper burst of inflation in the 1980s. Yet an average bill of this size would mask big differences between industries and countries. Ghana’s government, for instance, would face a debt-to-revenue ratio of over six and government-bond yields of 75%—which would almost certainly mean eye-watering cuts to state spending.

Inflation may ease the burden somewhat by pushing up nominal tax revenues, household incomes and corporate profits. And global debt as a share of gdp has fallen from its peak of 355% in 2021. But this relief has so far been more than offset by the considerable rise in interest rates. In America, for instance, real rates as measured by the yield on the five-year Treasury inflation-protected security sit at 1.5%, against an average of 0.35% in 2019.

So who is bearing the burden? We rank households, companies and governments across our 58 countries according to two variables: debt-to-income ratios and the increase in rates over the past three years. When it comes to households, rich democracies, including the Netherlands, New Zealand and Sweden, look more sensitive to rising interest rates. All three have debt levels nearly twice their disposable incomes and have seen short-term government-bond yields rise by more than three percentage points since the end of 2019.

Yet countries that have less time to prepare for rate rises may, in fact, face greater difficulties than their more indebted peers. Mortgages in the Netherlands, for instance, often have longer-term fixed rates, meaning the country’s households are probably better protected from higher rates than our rankings suggest. In other countries, by contrast, households typically either have shorter-term fixed-rate loans or borrow on flexible terms. In Sweden floating-rate mortgages account for nearly two-thirds of the stock, which means problems may emerge more quickly. In emerging economies the data are patchier. Although debt-to-income ratios are lower, this partly reflects the fact that formal credit is hard to obtain.

The worlds interest bill is 13trnand rising: Extended Excerpt Image 2


In the business world, surging consumer demand has lifted profits. In 33 of the 39 countries for which we have data, the ratio of debt to gross operating profit has fallen in the past year. Indeed, parts of the world look surprisingly strong. Despite the woes of Adani Group, a conglomerate under fire from a short-seller, India scores well, thanks to a relatively low debt-to-income ratio of 2.4, and a smaller rise in rates.

Big debt burdens and tighter financial conditions may still prove too much for some companies. s&p Global, a research firm, notes that default rates on European speculative-grade corporate debt rose from under 1% at the start of 2022 to more than 2% by the end of the year. French firms are especially indebted, with a ratio of debt to gross operating profit of nearly nine, higher than any country bar Luxembourg. Russia, cut off from foreign markets, has seen short-term yields spike. Hungary, where the central bank has rapidly raised rates to protect its currency, could face a big interest bill relative to the size of its economy.

Last and most consequential is government debt. Daleep Singh of pgim, an asset manager, says a variable to watch is the risk premium on debt (the extra return markets demand to hold a country’s bonds over and above the yield on an American Treasury). Rich-world governments are mostly doing fine on this measure. But Italy, which has seen one of the biggest increases in bond yields among euro-zone countries in our sample, remains a risk. As the European Central Bank tightens policy, it has stopped buying sovereign bonds, and will begin to shrink its balance-sheet in March. The danger is that this prompts a crunch.

Emerging economies increasingly borrow in their own currencies, but those struggling with external debts may require help. Argentina recently reached a bail-out agreement, which will require uncomfortable belt-tightening, with the imf. It sits near the top of this category, and already defaulted on its external debt in 2020. Egypt, which has medium-term government-bond yields around four to five percentage points above pre-pandemic levels, is trying not to follow suit. Ghana, which recently joined Argentina in the severely distressed camp, is now embarking on fiscal and monetary tightening in an attempt to secure support from the imf.

The fate of some governments, as well as the households and firms that eventually need state support, may depend on the goodwill of China. Despite high debt levels, China itself sits near the bottom of our rankings because of its placid interest rates. Yet its importance to global debt stress is only growing. China is now the largest lender to the world’s poor economies and gobbles up two-thirds of their inflating external debt-service payments, complicating debt-relief efforts. Western governments must hope they can shoot down this balloon, too.

  • Business Cycle
  • GDP
    • Financial Markets

Monday, February 27, 2023

United States' January Inflation Shock

AI Summary. Rent (9% of core), owners' equivalent rent (30%), and services excluding rents, medical care, hotels and airfares (28%) together make up about two-thirds of core consumer price inflation, and all are running above 7.5% year-over-year with none having clearly peaked. If disinflation has begun, the run rate is not yet materially below last summer's.

Chris Marsh Money: Inside and Out
Date Posted:
February 27, 2023

.@GeneralTheorist writes, “The ‘Great Reflation’ in the US has not yet run its course.” He notes of rent, owners’ equivalent rent, and adjusted services (2/3 of the Core CPI basket collectively): “None has definitely peaked.”

Has core inflation's largest components begun to slow?

Core argument: Rent (9% of Core CPI), owners' equivalent rent of primary residence (30%), and adjusted services excluding OER, rent, medical services, hotels and airfares (28%) are all running above 7.5% YoY, and none has definitely peaked.

Another way of looking at the Fed’s predicament is by showing the YoY% inflation of Rent (9% weight in Core), Owner Equivalent Rent of Primary Residence (weight 30%), and our Adjusted Services (that is, ex. OER, Rent, Medical services, hotels and airfares; 28% weight.) These three items represent two-thirds of Core CPI and none has definitely peaked in YoY% terms—and all are running above 7.5%YoY, as in the chart below. Of course, a sequential read on these might be different. But the experience in the Jan. CPI print is that if disinflation has begun, the run rate is not yet materially lower than that recorded last summer or the YoY% print.

Takeaways by Macro Roundup® AI

  1. Rent (9% of Core CPI), owners' equivalent rent of primary residence (30%), and adjusted services excluding OER, rent, medical services, hotels and airfares (28%) are all running above 7.5% YoY, and none has definitely peaked.
  2. Rent, owners' equivalent rent, and adjusted services together represent two-thirds of Core CPI.
  3. The January CPI print suggests that if disinflation has begun, the run rate is not yet materially lower than that recorded last summer or than the YoY% print.
  • Inflation
  • GDP
  • Monetary Policy

Americans' Incomes Are Rising Too Fast for 2% Inflation

AI Summary. Revised data imply wage and salary income for private sector workers has been rising at a 10% annualized rate, up from roughly 6% a year under earlier estimates. The revision mostly reflects higher estimates of the number of people working and hours worked rather than pay per worker, which should mute the potential inflation impact.

Matt Klein The Overshoot
Date Posted:
February 27, 2023

. @M_C_Klein notes, “The average American’s disposable income has been rising 10%/yr since last summer thanks to falling tax payments (lower cap gains obligations), huge increases in Social Security benefits, and—most importantly—soaring employment income.”

Is faster growth in worker income incompatible with 2% inflation?

Core argument: Revised data imply U.S. private-sector wage and salary income has risen at a 10% annualized rate since June, versus roughly 6% a year throughout 2022 under the old data.

Worker pay matters for inflation because it is the largest and least volatile source of financing for consumer spending. The old data implied that wages and salaries paid to private sector workers were rising about 6% a year throughout 2022. The new data imply that wage and salary income has been rising 10% annualized since June. But this mostly seems to reflect upward revisions to estimates of the number of people working (and the length of their workweeks), rather than how much each worker is getting paid. That should mute the potential impact on inflation—assuming the extra employees are doing useful things with their time.

Takeaways by Macro Roundup® AI

  1. Revised data imply U.S. private-sector wage and salary income has risen at a 10% annualized rate since June, versus roughly 6% a year throughout 2022 under the old data.
  2. The faster growth in aggregate pay mostly reflects upward revisions to estimates of the number of people working and the length of their workweeks, rather than how much each worker is paid.
  3. Worker pay matters for inflation because it is the largest and least volatile source of financing for consumer spending, though the composition of the revisions should mute the potential inflation impact if the additional employees are doing useful work.
  • Inflation
  • GDP
  • Monetary Policy

War in Ukraine Drives New Surge of U.S. Oil Exports to Europe

AI Summary. Average monthly seaborne U.S. crude cargoes to Europe rose 38% after Russia's invasion of Ukraine compared with the prior 12-month period, according to ship-tracking data, with Spain alone increasing purchases about 88%. U.S. natural gas shipments to Europe more than doubled, cushioning households and manufacturers after Russia throttled supplies.

David Uberti and Bob Henderson Wall Street Journal
Date Posted:
February 27, 2023
Is Database:
Database

As American energy exports to Europe surge, @DanielYergin notes that, “America is back in the most predominant position it has been in world energy since the 1950s.” @WSJ

Has war in Ukraine increased U.S. oil and gas exports to Europe?

Core argument: Average monthly seaborne U.S. oil cargoes to Europe rose 38% since Russia's February 2022 invasion of Ukraine compared with the prior 12-month period, according to ship-tracking firm Kpler.

Since February 2022, when Russia invaded Ukraine, average monthly seaborne cargoes to the continent jumped 38% compared with the previous 12-month period, according to ship-tracking firm Kpler. According to the White House, U.S. natural gas shipments to Europe more than doubled last year, cushioning the continent’s households and manufacturers after Russia throttled supplies. A fleet of skyscraper-size tankers carried more crude to Germany, France and Italy—the European Union’s largest economies—as well as Spain, which alone boosted purchases by about 88% over the period. The pull of oil shipments from the Gulf Coast to Europe, which Kpler pegged at 1.53 million barrels a day in January, has in recent months made the continent a larger destination for U.S. crude than Asia.

Takeaways by Macro Roundup® AI

  1. Average monthly seaborne U.S. oil cargoes to Europe rose 38% since Russia's February 2022 invasion of Ukraine compared with the prior 12-month period, according to ship-tracking firm Kpler.
  2. Kpler pegged Gulf Coast oil shipments to Europe at 1.53 million barrels a day in January, with Europe surpassing Asia as a destination for U.S. crude and Spain boosting purchases about 88%.
  3. U.S. natural gas shipments to Europe more than doubled last year, cushioning the continent's households and manufacturers after Russia throttled supplies, according to the White House.
  • Energy
  • GDP
    • Trade (not deficits)

How The Titans of Tech Investing Are Staying Warm Over The VC Winter

AI Summary. The tech-heavy Nasdaq index fell by a third in a year, and Silicon Valley Bank data show the average value of recently listed US tech stocks dropped 63% over four quarters while late-stage private firm values fell 56%. PitchBook data show US funds worth over $1bn accounted for 57% of all venture capital, up from 20%.

Economist Staff The Economist
Date Posted:
February 27, 2023
Is Database:
Database

Money flowing into startups globally fell by a third in 2022 as valuations declined; however, there is still $300B of VC dry powder in the US alone. @TheEconomist

How are large venture funds capturing a growing share of capital?

Core argument: The Nasdaq fell by a third in 2022, one of the worst years on record, drawing comparisons with the dotcom bust of 2000-01.

The tech-heavy Nasdaq index fell by a third in 2022, making it one of the worst years on record and drawing comparisons with the dotcom bust of 2000-01. According to the Silicon Valley Bank, a tech-focused lender, between the fourth quarters of 2021 and 2022, the average value of recently listed tech stocks in America dropped by 63%. And the plunging public valuations dragged down private ones. The value of older, larger private firms (“late-stage” in the lingo) fell by 56% after funds marked down their assets or the firms raised new capital at lower valuations. What new VC funding there is increasingly flows into mega-funds. Data from PitchBook, a research firm, show that in America in 2022 funds worth more than $1bn accounted for 57% of all capital, up from 20% in 2018.

Takeaways by Macro Roundup® AI

  1. The Nasdaq fell by a third in 2022, one of the worst years on record, drawing comparisons with the dotcom bust of 2000-01.
  2. PitchBook data show that in America in 2022, funds worth more than $1bn accounted for 57% of all venture capital, up from 20% in 2018.
  3. Silicon Valley Bank found that between the fourth quarters of 2021 and 2022 the average value of recently listed American tech stocks fell 63%, while late-stage private firms' value dropped 56%.

Money flowing into startups globally fell by a third in 2022 as valuations declined; however, there is still $300B of VC dry powder in the US alone.

“…The tech-heavy Nasdaq index fell by a third in 2022, making it one of the worst years on record and drawing comparisons with the dotcom bust of 2000-01. According to the Silicon Valley Bank, a tech-focused lender, between the fourth quarters of 2021 and 2022, the average value of recently listed tech stocks in America dropped by 63%. And the plunging public valuations dragged down private ones. The value of older, larger private firms (“late-stage” in the lingo) fell by 56% after funds marked down their assets or the firms raised new capital at lower valuations. What new VC funding there is increasingly flows into mega-funds. Data from PitchBook, a research firm, show that in America in 2022 funds worth more than $1bn accounted for 57% of all capital, up from 20% in 2018….”

Economist Staff, “How the titans of tech investing are staying warm over the VC winter,” The Economist, February 26, 2023, https://www.economist.com/business/2023/02/26/how-the-titans-of-tech-investing-are-staying-warm-over-the-vc-winter

How the titans of tech investing are staying warm over the VC winter

Venture capitalists are not known for their humility. But the world’s biggest investors in innovation have been striking a more humble tone of late. In a recent letter to investors Tiger Global, a hedge fund turned venture-capital (vc) investor, reportedly admitted that it had “underestimated” inflation and “overestimated” the boost the pandemic would give to the tech startups in its portfolio. In November Sequoia, a Silicon Valley vc blue blood, apologised to investors in its funds after the spectacular blow-up of ftx, a now defunct crypto-trading platform that it had backed. Speaking in January, Jeffrey Pichet Jaensubhakij, the chief investment officer of gic, one of Singapore’s sovereign-wealth funds, said that he was “thinking much more soberly” about startup investing.

The vc giants’ newfound contrition comes on the back of a gigantic tech crash. The tech-heavy nasdaq index fell by a third in 2022, making it one of the worst years on record and drawing comparisons with the dotcom bust of 2000-01. According to the Silicon Valley Bank, a tech-focused lender, between the fourth quarters of 2021 and 2022, the average value of recently listed tech stocks in America dropped by 63%. And the plunging public valuations dragged down private ones (see chart 1). The value of older, larger private firms (“late-stage” in the lingo) fell by 56% after funds marked down their assets or the firms raised new capital at lower valuations.

This has, predictably, had a chilling effect on the business of investing in startups. Soaring inflation and rising interest rates made companies whose promised profits lie primarily in the distant future look less attractive today. Scandals like ftx did not help. After a decade-long bull run, the amount of money flowing into startups globally declined by a third in 2022, calculates cb Insights, a data provider (see chart 2). In the final three months of 2022 it fell to $66bn, two-thirds lower than a year earlier; the number of mega-rounds, in which startups raise more than $100m, fell by 71%. Unicorns, the supposedly uncommon private firms valued at more than $1bn, became rarer again: the number of new ones contracted by 86%.

This turmoil is forcing the biggest venture investors—call them the vc whales—to shift their strategies. For Silicon Valley, it signals a reversion to a forgotten style of venture capitalism, with fewer deep-pocketed tourists splashing the cash and more bets on young companies by Silicon Valley stalwarts.

Misadventure capital

To understand the scale of vc’s reversal of fortune, consider its earlier bonanza. Between 2012 and 2021 annual global investments grew roughly ten-fold, to $638bn. Conventional vc firms faced competition from a new breed of investor from beyond Silicon Valley. These included hedge funds, the venture arms of multinational companies, from Shell to Samsung, and the world’s sovereign-wealth funds, some of which began investing in startups directly. Dealmaking turned frenetic. In 2021 Tiger Global inked almost one new deal a day. Across vc-dom activity “was a bit unhinged”, says Roelof Botha, boss of Sequoia Capital, “but rational”, given that low interest rates meant that money was virtually free. And “if you weren’t doing it, your competitor was.”

What passed for rationality in the boom times now looks somewhat insane. The downturn has spooked the vc funds’ main sources of capital—their limited partners (lps). This group, which includes everyone from family offices and university endowments to industrial firms and pension funds, is growing more nervous. And stingier: lower returns from their current investments leave lps with less capital to redeploy, and collapsing stockmarkets have left many of them overallocated to private firms, whose valuations take longer to adjust and whose share of some lps’ portfolios thus suddenly exceeds their quotas. Preqin, a data firm, finds that in the last quarter of 2022 new money flowing into vc funds fell to $21bn, its lowest level since 2015.

What new vc funding there is increasingly flows into mega-funds. Data from PitchBook, a research firm, show that in America in 2022 funds worth more than $1bn accounted for 57% of all capital, up from 20% in 2018. How the vc whales behind these outsize pools of capital adapt to the vc winter will determine the shape of the industry in the years to come.

The venture cetaceans can be divided into three big subspecies, each typified by big-name investors. The startups they finance range from the newly founded, in need of “seed” funding, to the somewhat older, later stage firms that are looking to rapidly grow. First there is the conventional Silicon Valley royalty, such as Sequoia and Andreessen Horowitz. The second group comprises the private tourists, such as Tiger and its New York hedge-fund rival, Coatue, as well as SoftBank, a gung-ho Japanese investment house. Then there are the sovereign-wealth funds, such as Singapore’s gic and Temasek, Saudi Arabia’s Public Investment Fund (pif) and Mubadala of the United Arab Emirates. As well as investing directly, these entities are lps in other vc funds; pif, for example, is a large backer of SoftBank’s Vision Fund.

Together these nine institutions ploughed more than $200bn into startups in 2021 alone, or roughly a third of the global total (not counting the state funds’ indirect investments as lps). All nine have been badly damaged by last year’s crash. Sequoia’s crossover fund, which invested in both public and private firms, reportedly lost two-fifths of its value in 2022. Temasek’s listed holdings on American exchanges shrank by about the same. SoftBank’s mammoth Vision Funds, which together raised around $150bn, lost more than $60bn, wiping out their previous gains. In a sign that things were terrible, its typically garrulous boss, Son Masayoshi, sat out its latest earnings call on February 7th. Tiger reportedly lost over half of the value of its flagship hedge fund and marked down its private investments by about a quarter, torching $42bn in value and leading one vc grandee to speculate that the hedge fund might turn itself into a family office.

All three groups have reined in their investments. But each has responded to the downturn in distinct ways. That is in part because it has affected them to different degrees.

The private outsiders have been hardest hit. The combined number of startup investments by the three firms in our sample fell by 76% between the second half of 2021 and the same period in 2022. Tiger has lowered the target for its latest fund from $6bn to $5bn; its previous one raised $13bn. In October Phillipe Laffont, Coatue’s boss, said that the hedge fund was holding 70-80% of its assets in cash. The firm has also raised $2bn for its “tactical solutions fund”, designed to give mature startups access to debt and other resources, as an alternative to raising equity at diminished valuations during a market downturn. SoftBank has all but stopped investing in new startups. Instead, in the second half of 2022 most of its capital went to well-performing portfolio firms, says Lydia Jett, a partner at the Vision Fund.

The other two groups are also retrenching, but not as drastically. According to data from PitchBook, in the second half of 2022 the number of deals struck by Sequoia and Andreessen Horowitz fell by a combined 47%. Direct investments by the four sovereign funds in our sample slowed by a more modest 31% in the same period, no doubt thanks to their governments’ deep pockets and longer time horizons.

Taken together, venture capitalists’ slowing pace of investment has left them with a record amount of capital that lps had already pledged to stump up but that has yet to be put to use. Last year the amount of this “dry powder” was just shy of $300bn in America alone (see chart 3). According to data from PitchBook, our five private whales are sitting on a combined $50bn or so; the sovereign investors hold their numbers close to their chest but are likely to be of a similar order of magnitude, all told. Some of it may wait a long while to be deployed, if it ever is. But some will find grateful recipients. Who those recipients are also depends on which group of whales you look at.

Conventional vcs and the hedge funds are focusing on younger “early-stage” firms. in part because volatility in the public markets makes it harder to value more mature companies that hope to list in the near future. Mr Botha says that Sequoia has doubled the number of “seed” deals with the youngest companies in 2022, compared with 2021. In January the firm launched its fifth seed fund, worth $195m. Last April Andreessen Horowitz launched an “accelerator” programme to nurture startups. About half the startups Tiger backed in 2022 were worth $50m or less, compared with just a fifth in 2021, according to PitchBook.

Early-stage firms are unlikely to be the only recipient of vc cash. David DiPietro, head of private equity at T. Rowe Price, a fund-management group, thinks that startups selling “must-have” products, such as cyber-security services, or cost-cutting tools, such as budgeting software, should fare well. Money will also keep flowing to well-managed businesses with strong balance-sheets., expects Kelly Rodriques, chief executive of Forge, a marketplace for private securities. Firms with buzzy new technologies, such as artificial-intelligence chatbots and other forms of whizzy “generative ai”, are also likely to attract investments—especially if those technologies already work in practice and underpin a viable business model.

Another category of startups likely to gain favour comprises those involved in industries that governments deem strategic. In America, that means climate-friendly technology and advanced manufacturing, on which Uncle Sam is showering subsidies and government contracts. Some 8% of the deals all our whales made in the second half of 2022 involved firms working on technologies to combat climate change, for example, up from 2% in the same period of 2021. Last year Andreessen Horowitz launched an “American Dynamism” fund, which partly invests in firms that rely on government procurement, such as Anduril, a defence-tech startup.

Sovereign-wealth funds are likely to be looking elsewhere. Seed deals are simply too small for them: whereas the typical early-stage American company is worth about $50m, in 2021 the median value of startups backed by the sovereign funds was a whopping $650m. And to them, what counts as “must-have” startups is somewhat different, determined less by the market or other states’ strategic imperatives, and more by their own governments’ nation-building plans.

On February 16th pif said it would take a stake in vspo, a Chinese platform for video-game tournaments. This is part of a plan dreamed up by Muhammad bin Salman, the Saudi crown prince, to invest $38bn in “e-sports” by 2030 and make Saudi Arabia a gamer’s mecca. Temasek invests heavily in firms that develop technology to boost food production. In the past year it backed Upside Foods, a startup selling lab-grown meat, and InnovaFeed, a maker of insect-based protein. This is motivated by Singapore’s goal of locally producing 30% of the city-state’s nutritional needs by 2030, up from about 10% in 2020. Rohit Sipahimalani, chief investment officer of Temasek, thinks that over the next few years his focus will shift towards “breakthrough innovation rather than incremental innovation”, on the back of government support of strategic tech.

One group of firms is likely to see less investment from our whales, however: those in China. The Communist Party’s harsh two-year crackdown on consumer technology may be easing but the vc titans remain wary of what was until recently one of the world’s hottest startup scenes. An executive at a big venture fund says that in the past, foreign investors in China knew that the government would be respectful of their capital. Now, he sighs, it feels like the government “has pulled the rug out from underneath us”.

Tiger has said that there is a “high bar” for new investments in China. gic has reportedly scaled back its investments in China-focused private funds. Mr Sipahimalani of Temasek says diplomatically that he is trying to avoid investing in “areas caught in the cross-hairs of us-China tension”. Sequoia is reportedly asking external experts to screen new investments made by its Chinese arm into quantum computing and semiconductors, two such contentious areas. All told, the number of our whales’ deals with Chinese startups fell from 22% of the total in 2021 to 16% in 2022.

After the dotcom crunch vc investments needed nearly two decades to return to their previous peak. Today’s tech industry is more mature, startups’ balance-sheets are stronger and, according to the Silicon Valley Bank, their peak valuations relative to sales are lower than in 2000-01. This time the whales of vc are unlikely to need 20 years to nurse their wounds. But the experience will have lasting effects on the sort of businesses they back.

  • Startups
  • GDP
    • Business Cycle
    • Financial Markets
  • Productivity
    • Innovation/Research
    • Investment

Mulligan And The Demand For Opioids

AI Summary. Opioid users can buy either legally prescribed drugs or illegal ones, with entering the illegal market carrying a one-time fixed cost. Because illegal opioids have a lower cost per additional dose, raising the price of prescription opioids can push users to pay that entry cost and consume more overall.

John Cochrane The Grumpy Economist
Date Posted:
February 27, 2023

.@JohnHCochrane reports on a @caseybmulligan presentation that explains how opioid consumption increased despite higher prices.

Do higher prescription opioid prices increase total opioid consumption?

Core argument: Opioid purchases fall into two channels: legal or semi-legal prescriptions originating with pharmaceutical companies, and illegal purchases, with entry into the illegal market requiring a fixed cost the user must first overcome.

There are two ways to buy opioids, 1) legally or semi-legally; i.e. get opioids that come from pharmaceutical companies and are prescribed to someone by a doctor or 2) illegally. There is a fixed cost of entering the illegal market. So, imagine a drug user starting at B. At that price for legal (red) and illegal (black) drugs, the user chooses legal drugs at point B. Now raise the price of legal drugs, as shown by the arrow. If the user stayed with legal drugs, he or she would use less. But now there is an option, incur the fixed cost and buy illegal drugs on the black line. At the higher price for legal drugs that makes sense. But since the marginal cost of illegal drugs is lower, once the user has overcome the fixed cost, he or she uses more. Raise the price, and they consume more (of a substitute).

Takeaways by Macro Roundup® AI

  1. Opioid purchases fall into two channels: legal or semi-legal prescriptions originating with pharmaceutical companies, and illegal purchases, with entry into the illegal market requiring a fixed cost the user must first overcome.
  2. Raising the price of legal opioids can push a user who would otherwise cut back to instead pay the fixed cost of entering the illegal market, where the lower marginal cost leads to greater consumption.
  • Poverty/Crime
  • Workforce

Covid-Era Savings Are Crucial to China’s Economic Recovery

AI Summary. Chinese households' saving rate reached a multiyear high of 33%, and economists at HSBC and Morgan Stanley project the end of strict zero-Covid policies will fuel a services spending recovery lifting consumption growth to at least its prepandemic pace of about 8% a year.

Stella Yifan Xie Wall Street Journal
Date Posted:
February 27, 2023
Is Database:
Database

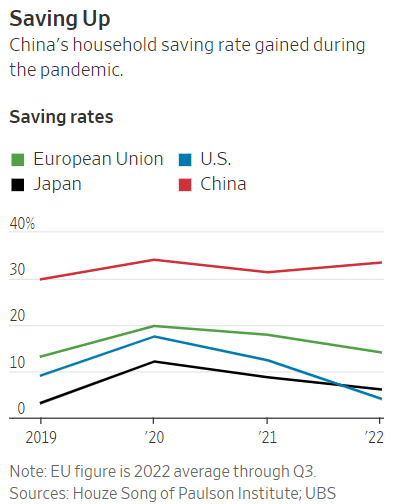
China’s household savings rate was 33% in 2022, 3pp above the pre-pandemic trend, and big industrial companies added $1.1 trillion in liquid assets on average each year, more than double the $467 billion annual increase in the five years before Covid. @WSJ

Will pandemic-era household savings power China's consumption recovery?

Core argument: China's household saving rate rose to a multiyear high of 33% in 2022 as families constrained by Covid lockdowns hoarded cash.

Chinese families, constrained by Covid lockdowns, hoarded cash and pushed up the country’s household saving rate to a multiyear high of 33% in 2022.  Economists from HSBC and Morgan Stanley say the end of China’s strict zero-Covid policies will at minimum fuel a strong recovery in services spending, lifting consumption growth to at least its prepandemic rate of around 8% a year. A large portion of new deposits accumulated by Chinese households last year was locked up in three-year to five-year deposit instruments, which can’t as easily be converted into spending as short-term deposits can, according to a study by research firm Rhodium Group.

Takeaways by Macro Roundup® AI

  1. China's household saving rate rose to a multiyear high of 33% in 2022 as families constrained by Covid lockdowns hoarded cash.
  2. Economists at HSBC and Morgan Stanley say the end of China's zero-Covid policies will at minimum drive a strong services spending recovery, lifting consumption growth to at least its prepandemic pace of around 8% a year.
  3. A study by research firm Rhodium Group finds a large portion of Chinese households' new deposits was locked into three-year to five-year instruments, which convert into spending less easily than short-term deposits.

China’s household savings rate was 33% in 2022, 3pp above the pre-pandemic trend, and big industrial companies added $1.1 trillion in liquid assets on average each year, more than double the $467 billion annual increase in the five years before Covid.

“…Chinese families, constrained by Covid lockdowns, hoarded cash and pushed up the country’s household saving rate to a multiyear high of 33% in 2022. Economists from HSBC and Morgan Stanley say the end of China’s strict zero-Covid policies will at minimum fuel a strong recovery in services spending, lifting consumption growth to at least its prepandemic rate of around 8% a year. A large portion of new deposits accumulated by Chinese households last year was locked up in three-year to five-year deposit instruments, which can’t as easily be converted into spending as short-term deposits can, according to a study by research firm Rhodium Group….”

Stella Yifan Xie, “Covid-Era Savings Are Crucial to China’s Economic Recovery,” Wall Street Journal, February 26, 2023, https://www.wsj.com/articles/covid-era-savings-are-crucial-to-chinas-economic-recovery-1ee3310b

Covid-Era Savings Are Crucial to China’s Economic Recovery

The strength of China’s economic rebound this year largely hinges on one uncertainty: whether families and large companies are willing to draw down the pile of cash they built up since the start of Covid-19.

Chinese families, constrained by Covid lockdowns, hoarded cash and pushed up the country’s household saving rate to a multiyear high of 33% in 2022, up 3 percentage points from the prepandemic trend in 2019, according to estimates by Goldman Sachs.

Large industrial companies and exporters also socked away money. From 2020 to 2022, big industrial companies, many state-owned, added $1.1 trillion in liquid assets on average each year, more than double the $467 billion annual increase in the five years before Covid hit, according to economists at China International Capital Corp., an investment bank.

In the U.S., excess savings—some from government stimulus—quickly coursed through the economy, but many experts wonder whether China will likewise have a big rebound in spending or investment this year.

Economists from HSBC and Morgan Stanley say the end of China’s strict zero-Covid policies will at minimum fuel a strong recovery in services spending, lifting consumption growth to at least its prepandemic rate of around 8% a year. Initial data from China’s recent Lunar New Year holiday suggest some Chinese consumers are eager to dine out and visit cinemas again.

Other economists feel more skeptical.

They argue that the savings buildup in China is more a reflection of battered confidence, which is unlikely to be reversed quickly as pains from the pandemic linger. Many Chinese consumers remain nervous because of a depressed housing market and an uncertain jobs picture, which could make them save more and spend less for longer.

“It is premature to conclude that excess savings accumulated by households will support revenge spending in a persistent way,” said David Wang, chief China economist at Credit Suisse.

A slow consumption rebound in China could reverberate globally, damping sales for such companies as Nike Inc., Starbucks Corp. and international auto makers, and resulting in lower-than-expected demand for such commodities as copper and nickel. Many businesses are counting on China, which is projected to account for a third of global growth this year as growth in the U.S. and Europe slows, according to the International Monetary Fund.

Swelling household savings helped push China’s current-account surplus to $417.5 billion last year, the highest level since 2008, underscoring just how entrenched the global trade imbalance has been even as the U.S. and other more-advanced economies attempt to reduce reliance on Chinese imports.

It isn’t clear exactly how big China’s savings pile is. Many economists, concerned about data quality in China, use different methods for their calculations.

Goldman Sachs says it believes Chinese families accumulated about three trillion yuan, equivalent to roughly $431 billion, in excess savings, or less than 3% of China’s gross domestic product, from 2020 to 2022. Economists from Nomura and UBS put the figures higher, at 6.1 trillion yuan and up to 4.6 trillion yuan, respectively, or about 5% and close to 4% of GDP in 2022.

While sizable, those figures are lower than in the U.S., where households put away $2.3 trillion in excess savings from 2020 through September 2021, or nearly 10% of GDP in 2021, according to a study published by the Federal Reserve.

A large portion of new deposits accumulated by Chinese households last year was locked up in three-year to five-year deposit instruments, which can’t as easily be converted into spending as short-term deposits can, according to a study by research firm Rhodium Group.

Given that China’s government refrained from handing out checks directly to households during the pandemic, it could take a while before people become more confident in China’s recovery and significantly scale back their saving, said Tao Wang, an economist at UBS.

More relevant to consumers’ spending appetite, economists say, are income growth and the job market, both of which are recovering slowly.

Zhou Changtian, who works at a state-owned publishing house in Shanghai, ended up saving more during the past three years as his family wasn’t able to travel abroad. Even though he isn’t deeply worried about job security, he isn’t keen on splurging, partly because of inflation fears as the economy reopens.

“It used to cost us 1,000 yuan [about $145] to stock up on meat in the fridge before Covid. Now we have to pay double,” said Mr. Zhou. “I definitely won’t go on a spending spree.”

Some companies are loosening their purse strings in anticipation of a strong economic recovery. Several industrial companies in China have announced big-ticket projects, including Ganfeng Lithium—one of the world’s largest refiners of strategic metal—which last month unveiled a 15 billion yuan ($2.2 billion) investment to build two battery plants in China.

But Larry Hu, chief China economist at Macquarie Group, is cautious about whether corporations have strong incentives to spend. He expects overall capital expenditure to stay flat compared with last year, in part because of uncertainty at export-oriented companies as overseas demand has weakened.

Another concern: Even though big companies were able to put away money by delaying investments during the pandemic, many smaller Chinese businesses, lacking deep pockets, had to spend savings to survive. Many are still on the ropes—or wiped out entirely.

Beijing restaurant operator Nathan Zhang said he hasn’t been able to repay food and wine suppliers at a bistro he owns, because it was forced to shut down or banned from offering dine-in services several times under Covid restrictions. Even though those restrictions have ended, Mr. Zhang estimates that he has lost about 10% to 20% of his regular clientele.

“While we still harbor hope that the worst is behind us, there are still too many uncertainties,” he said.

  • Business Cycle
  • China
  • GDP
    • Savings Glut/Trade Deficit

China’s Economy Is Looking At A New Wave Of Japanification

AI Summary. Citigroup identifies parallels between China's economy and Japan's bubble era: both sustained strong growth through infrastructure investment and export promotion, financed largely through indirect bank lending that authorities could direct toward favored sectors. Capital formation averaged 43% of Chinese GDP growth between 2010 and 2020, versus roughly 36% in Japan when its bubble burst.

Leo Lewis Financial Times
Date Posted:
February 27, 2023

A Citigroup analysis highlights parallels between the late ‘80s Japanese investment bubble and recent investment trends in China: capital formation as an outsized proportion of GDP and a development strategy reliant on large current account surpluses.

A Citigroup analysis highlights parallels between the late ‘80s Japanese investment bubble and recent investment trends in...

Does China's growth model resemble Japan's bubble-era economy?

Core argument: Capital formation averaged 43% of China's GDP growth between 2010 and 2020, according to the World Bank, above the roughly 36% share Japan recorded when its bubble burst in 1990, a level then considered very high.

Citigroup identifies several areas of similarity. Both countries entered extended phases of strong GDP growth via investment in infrastructure and the encouragement of exports. Between 2010 and 2020, capital formation represented an average 43% of Chinese GDP growth, according to the World Bank. When its bubble burst in 1990, Japan’s capital formation proportion was at roughly 36%, and considered very high. Japan and China also financed their growth in a similar way. Japan’s bubble era was fuelled by indirect financing provided by commercial banks, which were nudged by the authorities into funnelling soft loans towards favoured industrial sectors. Similarly, says Citigroup, China has developed a financial system mainly dependent on indirect financing. As well as the tools available to the People’s Bank of China, the government can direct the lending activities of commercial banks via a series of mechanisms.

Takeaways by Macro Roundup® AI

  1. Capital formation averaged 43% of China's GDP growth between 2010 and 2020, according to the World Bank, above the roughly 36% share Japan recorded when its bubble burst in 1990, a level then considered very high.
  2. Citigroup identifies similarities between China and Japan, noting both entered extended phases of strong GDP growth driven by infrastructure investment and the encouragement of exports.
  3. Japan's bubble era was fuelled by indirect financing from commercial banks nudged by authorities into soft loans for favoured industrial sectors, and Citigroup says China likewise depends mainly on indirect financing, with the government able to direct commercial bank lending.
  • China
  • GDP
    • Business Cycle
    • Savings Glut/Trade Deficit


Loading More Posts

End of content

No more pages to load

© Copyright 2026 Coherent Research Institute · All Rights Reserved · Privacy · Terms