Edward Conard

Top Ten New York Times Bestselling Author

  • “Unintended Consequences offers deep and well-argued analyses on almost every issue.” - The New York Times
  • “…reminds us that inequality sends a signal of what society lacks most, in America’s case, entrepreneurship and risk taking.” - Lawrence Lindsey, CEO, The Lindsey Group, former Director of the National Economic Council
  • “…a fresh argument for the productive value of inequality.” - David Autor, Professor of Economics, Massachusetts Institute of Technology
  • “…challenges misconceptions that distort our economic debates.” - Arthur Brooks, President of the American Enterprise Institute
  • “…a fresh argument for the productive value of inequality.” - David Autor, Professor of Economics, Massachusetts Institute of Technology
  • “…serious thinking for serious thinkers. …a thought-provoking blueprint for growing middle- and working-class incomes.” - Mitt Romney, former Governor of Massachusetts
  • “…challenges misconceptions that distort our economic debates.” - Arthur Brooks, President of the American Enterprise Institute
  • “…a very valuable contribution.” - Larry Summers, former Secretary of the Treasury and director of the National Economic Council, president emeritus, Harvard University
  • “…a must-read for serious students of economic policy.” - Glenn Hubbard, Dean, Columbia Business School, and former Chairman of the Council of Economic Advisers
  • “…reminds us that inequality sends a signal of what society lacks most, in America’s case, entrepreneurship and risk taking.” - Lawrence Lindsey, CEO, The Lindsey Group, former Director of the National Economic Council
  • “…a comprehensive explanation of the modern economy.” - Julian Robertson, Founder, Tiger Management
  • “…a comprehensive explanation of the modern economy.” - Julian Robertson, Founder, Tiger Management
Upside of Inequality Oxford Unintended Consequences
Buy the Books
  • Macro Roundup
  • About Roundup
  • About Ed Conard
  • Highlights
  • Topics
  • Subscribe
Edward Conard
  • twitter
  • facebook
  • linkedin
  • youtube

Macro Roundup

  • Email
  • Text Message (SMS)
  • Twitter/X
  • LinkedIn
  • Facebook
  • WhatsApp Message
Subscribe to Macro Roundup Emails
Select topics to choose: articles that mention them (broader) or articles mainly about them (focused)
  • Mentions 0
  • Primary focus 0
Showing all 7,320 Macro Roundup articles
When you search for any topic (like GDP, Inflation, or Banking), choose:
Choose search scope

Friday, December 9, 2022

All Pain and No Gain From Higher Interest Rates

AI Summary. The article argues that pandemic-era sectoral supply constraints, demand shifts, and adjustment asymmetries were the main drivers of price growth, and that inflation is already moderating for those reasons rather than because of higher interest rates. It contends higher rates add little disinflation while making it harder to finance investment that would ease supply shortages.

Joe Stiglitz Project Syndicate
Date Posted:
December 9, 2022

.@JosephEStiglitz argues that current inflationary pressure is supply-side driven and states higher interest rates may exacerbate inflationary pressures.

.@JosephEStiglitz argues that current inflationary pressure is supply-side driven and states higher interest rates may...

Do higher interest rates add little disinflation while hindering supply investment?

Core argument: Pandemic-era sectoral supply constraints, demand shifts, and adjustment asymmetries were the primary drivers of price growth, so higher interest rates deliver minimal additional inflation reduction beyond what would have occurred anyway.

The pandemic gave rise to numerous sectoral supply constraints and demand shifts that – together with adjustment asymmetries – became the primary drivers of price growth. Any benefits from the extra interest-rate-driven reduction in inflation will be minimal compared to what would have happened anyway. Inflation already appears to be easing. It may be moderating more slowly than optimists hoped a year ago – before Russia’s war in Ukraine – but it is moderating nonetheless, and for the same reasons that optimists had outlined. Higher interest rates make it even more difficult to mobilize investments that could alleviate supply shortages.

Takeaways by Macro Roundup® AI

  1. Pandemic-era sectoral supply constraints, demand shifts, and adjustment asymmetries were the primary drivers of price growth, so higher interest rates deliver minimal additional inflation reduction beyond what would have occurred anyway.
  2. Inflation is moderating for the same reasons optimists outlined, though more slowly than they hoped before Russia's war in Ukraine.
  3. Higher interest rates make it more difficult to mobilize investments that could alleviate supply shortages.
  • Inflation
  • GDP
  • Monetary Policy

“The Great Retirement Boom”: The Pandemic-Era Surge in Retirements and Implications for Future Labor Force Participation

AI Summary. An increase in the retired share of the working-age population of nearly 1.5 percentage points above pre-pandemic levels—more than 3.5m additional retirees—accounts for essentially all of the shortfall in the labor force participation rate, while other causes of non-participation such as caregiving have receded.

Joshua Montes, Christopher Smith and Juliana Dajon Federal Reserve Board
Date Posted:
December 9, 2022
Is Database:
Database

In October 2022, the retired share of the American population was 1½ percentage points above its pre-pandemic trend. These 3.5 million workers account for essentially all of the shortfall in labor force participation rates. @federalreserve

Do increased retirements explain the entire labor force participation shortfall?

Core argument: The labor force participation rate for the working-age population in October 2022 stood nearly 1.5 percentage points below its February 2020 level, after adjusting for population weight changes introduced from the 2020 Census.

Despite some improvement in the labor force participation rate for the working-age population since the early stages of the pandemic, the LFPR in October 2022 remained nearly 1½ percentage points below its pre-pandemic, February 2020 level (after making adjustments for changes in population weights introduced from the 2020 Census). The importance of retirements in accounting for this shortfall is illustrated in Figure 1, which shows the percentage of the working-age population that is not in the labor force for different reasons (black line) relative to February 2020, based on responses to the Current Population Survey. While earlier in the pandemic, factors other than retirements were an important contributor to elevated non-participation (such as non-participation while caregiving, the orange line), the percent of the population that was not in the labor force and retired (the[MRH1]  “retired share”) has steadily increased and in October 2022 was almost 1½ percentage points above its pre-pandemic level, representing an increase of more than 3½ million retirees and accounting for essentially all of the total shortfall in the LFPR.

Takeaways by Macro Roundup® AI

  1. The labor force participation rate for the working-age population in October 2022 stood nearly 1.5 percentage points below its February 2020 level, after adjusting for population weight changes introduced from the 2020 Census.
  2. The retired share of the working-age population was almost 1.5 percentage points above its pre-pandemic level in October 2022, an increase of more than 3.5 million retirees that accounts for essentially all of the participation shortfall.
  3. Current Population Survey responses show that non-retirement reasons such as caregiving were an important contributor to elevated non-participation earlier in the pandemic, while the retired share has steadily increased.

In October 2022, the retired share of the American population was 1½ percentage points above its pre-pandemic trend. These 3.5 million workers account for essentially all of the shortfall in labor force participation rates., “…Despite some improvement in the labor force participation rate for the working-age population since the early stages of the pandemic, the LFPR in October 2022 remained nearly 1½ percentage points below its pre-pandemic, February 2020 level (after making adjustments for changes in population weights introduced from the 2020 Census). The importance of retirements in accounting for this shortfall is illustrated in Figure 1, which shows the percentage of the working-age population that is not in the labor force for different reasons (black line) relative to February 2020, based on responses to the Current Population Survey. While earlier in the pandemic, factors other than retirements were an important contributor to elevated non-participation (such as non-participation while caregiving, the orange line), the percent of the population that was not in the labor force and retired (the “retired share”) has steadily increased and in October 2022 was almost 1½ percentage points above its pre-pandemic level, representing an increase of more than 3½ million retirees and accounting for essentially all of the total shortfall in the LFPR….”

The Evidence The pre-pandemic trend, “…Even in the absence of the pandemic, the retired share would likely have risen, albeit more gradually, due to shifts in the age distribution of the population toward ages traditionally associated with higher retired shares (primarily, the movement of the Baby Boomer cohort into older ages). As one illustration of the importance of population aging, Figure 2 plots the retired share (solid line) alongside a counterfactual trend (dashed line)….”

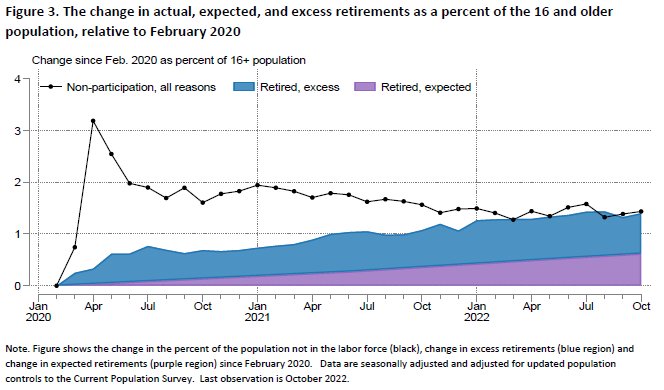
“…. This trend is an estimate of how the retired share would have evolved in the absence of the pandemic and is derived by assuming the continuation of pre-pandemic, age-specific trends in retired shares, assuming the state of the business cycle remained similar to pre-pandemic levels, and accounting for the actual changes in the age distribution over this period (in section III, we discuss in more detail the calculation of this and other counterfactual retired shares). Over the five years prior to the pandemic, the retired share increased about 0.2 percentage point per year, and plausibly would have continued increasing at a similar pace in the absence of the pandemic. As of October 2022, the retired share remained 0.6 percentage point above the pre-pandemic expected trend, or about 1.6 million people (Figure 2). This gap between the actual and expected lines is an estimate of “excess retirements,” and the excess retirements gap remains sizeable. In fact, the retired share was slightly below trend just prior to the pandemic (about 0.2 percentage point), implying that excess retirements as a share of the population have increased by about 0.8 percentage point since February 2020, or about 2.1 million people. That increase in excess retirements explains a little more than half of the 1.4 percentage point increase the total retired share since February 2020, whereas the increasing expected retired share explains the rest (see Figure 3)….”

“…Thus, less than half of the increase in the retired share to date would likely have occurred even in the absence of the pandemic, suggesting that more than half of the current LFPR shortfall is a direct result of the pandemic on retirement….First, as discussed above, more than half of the increase in the retired share relative to February 2020 is due to an increase that would have been expected in the absence of the pandemic. Second, about two-thirds of the total increase in the excess retired share is attributable to those who were age 65 and older at the start of the pandemic, with a particularly sharp increase in excess retirements among those age 70 and older. The remaining one-third of the increase in the excess retired share is attributable to those age 55 to 64 when the pandemic began. Third, there is also substantial heterogeneity across education, race, and ethnic groups, with retired shares for those age 65 and older increasing more than expected for Whites relative to Blacks and Hispanics, and for those with a college education relative to those without….…Because the retired share has remained significantly elevated since increasing substantially at the start of the pandemic and has shown little sign of converging towards its ex-pandemic counterfactual, it may take some years for retirement behavior to normalize relative to pre-pandemic norms and for the retired share of the population to converge toward what it would be in the absence of pandemic-related influences. We view it as unlikely, however, that the retired share will fall substantially towards its pre-pandemic trend and that those who retired early will return to the labor force in large numbers, since most of the excess retirements are concentrated among people who are 65 and older who (given their age) would likely be retiring in greater numbers anyway over the next few years. That assessment is supported by the stabilization of the unretirement rate at its pre-pandemic level, well below the level it would need to reach for the retired share to fall substantially…”

Joshua Montes, Christopher Smith, and Juliana Dajon, ” “The Great Retirement Boom”: The Pandemic-Era Surge in Retirements and Implications for Future Labor Force Participation,” Federal Reserve Board, November 2022, https://www.federalreserve.gov/econres/feds/the-great-retirement-boom.htm

Brandon Adams Comment: “This is a great paper. I think the labor force participation rate could converge toward its pre-pandemic trend line faster than envisioned in this paper. The paper ignores asset markets altogether, and it seems clear to me that rapidly inflating retirement accounts in 2021 was a big part of this story. Towards the tail end of the time period covered in this paper, retirees met the unwelcome duo of rapidly decreasing asset prices and rapidly increasing consumer prices. This might or might not bring people in their 60s or 70s out of retirement, but it will almost surely slow the exit rate of those aged 40-60, and it might also bring back into the labor force some people in that age range who are currently sitting out.”

  • Unemployment/Participation
  • Workforce

How Republicans Lost Their House Edge in Midterms

AI Summary. Republican US House candidates won 50.6% of votes to Democrats' 47.8% and are set to hold 222 of 435 seats to Democrats' 213, a 2.8-point vote margin yielding a 2.1-point seat margin. From 2010 through 2016 Republicans won a larger seat share relative to their vote share, most notably when Democrats' 1.1-point vote win produced a 7.6-point seat deficit.

Justin Fox Bloomberg
Date Posted:
December 9, 2022

A change in the way votes are distributed has eroded a GOP edge in the House of Representatives that the party has enjoyed over the past decade. @foxjust @bloomberg

Do House seat shares still favor one party over its vote share?

Core argument: Republican House candidates won 50.6% of votes cast in the Nov. 8 midterms to Democrats' 47.8%, a 2.8-point margin that translates into a narrower 2.1-point seat margin, 222 seats to 213.

The Nov. 8 midterm election results are nearly final, and Republican candidates have received 50.6% of the votes cast for the US House of Representatives to Democrats 47.8%. It also looks as if they will end up with 222 of the 435 House seats to the Democrats’ 213, or 51% to 49%. In other words, a vote margin of 2.8 percentage points will translate into a seat margin of 2.1 percentage points. This is not how things worked from 2010 through 2016 when Republicans won a much larger share of House seats compared with the votes they received. The disconnect was most pronounced in the 2012 election when Democrats’ 1.1-percentage-point winning vote margin resulted in a 7.6-point loss in terms of seats.

Takeaways by Macro Roundup® AI

  1. Republican House candidates won 50.6% of votes cast in the Nov. 8 midterms to Democrats' 47.8%, a 2.8-point margin that translates into a narrower 2.1-point seat margin, 222 seats to 213.
  2. From 2010 through 2016, Republicans won a much larger share of House seats than of votes, a disconnect absent from the near-final midterm results.
  3. The vote-seat disconnect was most pronounced in 2012, when Democrats' 1.1-point winning vote margin produced a 7.6-point deficit in House seats.
  • Politics

Biden Administration Quietly Approves Huge Texas Oil Export Project

AI Summary. US regulators approved what would be the nation's largest oil export terminal, off the Texas Gulf Coast, adding 2m barrels per day of export capacity. It is the first of four proposed offshore Texas terminals to win approval and would support continued growth in US shale production, working against goals for deep carbon emission cuts.

Dylan Baddour The Texas Tribune
Date Posted:
December 9, 2022

The Biden administration has approved the largest oil export facility in American history. The facility will expand export capacity by 2 million barrels per day, vs. 2021 average exports of 8.5 million barrels per day. @TexasTribune

The Biden administration has approved the largest oil export facility in American history. The facility will expand export...

Does approving the largest US oil export terminal conflict with emissions goals?

Core argument: The Biden administration approved the nation's largest oil export terminal off the Gulf Coast of Texas, which would add 2 million barrels per day to US oil export capacity.

The Biden administration has approved plans to build the nation’s largest oil export terminal off the Gulf Coast of Texas, which would add 2 million barrels per day to the US oil export capacity. The administration’s move marked a major step forward for the export sector. The offshore oil export terminal, the first to be approved of four proposed along Texas’s Gulf Coast, will enable continued growth in US shale oil production and global consumption, dealing a substantial setback to the White House’s goals for drastic cuts in carbon emissions by the year 2030.

Takeaways by Macro Roundup® AI

  1. The Biden administration approved the nation's largest oil export terminal off the Gulf Coast of Texas, which would add 2 million barrels per day to US oil export capacity.
  2. The project is the first of four proposed offshore oil export terminals along Texas's Gulf Coast to win approval, marking a major step forward for the export sector.
  3. The terminal is expected to enable continued growth in US shale oil production and global consumption, setting back the White House's goals for deep carbon emissions cuts by 2030.
  • Regulation
  • Fiscal Policy

The Five-Year Engineering Feat Germany Pulled Off in Months

AI Summary. Germany built a liquefied natural gas import terminal in months rather than the five years such projects normally require, with the first tanker expected to arrive once the facility is complete. The terminal will be operated by utility Uniper, which the German state agreed to nationalize.

Georgi Kantchev Wall Street Journal
Date Posted:
December 9, 2022

LNG import facilities in Germany are on schedule to be operational within a year, a process that usually would take five. @WSJ

LNG import facilities in Germany are on schedule to be operational within a year, a process that usually would take five....

Can a gas import terminal be built in months instead of years?

Core argument: Germany's government asked energy companies in March whether an LNG import terminal, normally requiring at least five years to build, could be erected in a port town by year's end.

In March, the German government asked energy companies to weigh a seemingly impossible engineering task. Could a new liquefied natural gas import terminal, which normally takes at least five years to build, be erected in this port town by year’s end? At the headquarters of the company asked to build the pipeline portion, technical director Thomas Hüwener posed that question to his team. “If no, then it’s a no,” he told them. “If yes, then we have to commit, with all the possible consequences for our company.” After three days of deliberations, the company concluded that if everything went perfectly, the project could be done by Christmas. Utility Uniper SE, which the German state recently agreed to nationalize and which will operate the terminal, said that if all goes according to plan, the first tanker carrying LNG will arrive at the start of next year.

Takeaways by Macro Roundup® AI

  1. Germany's government asked energy companies in March whether an LNG import terminal, normally requiring at least five years to build, could be erected in a port town by year's end.
  2. The company asked to build the pipeline portion concluded after three days of deliberation that the project could be done by Christmas if everything went perfectly, with technical director Thomas Hüwener citing possible consequences for the company.
  3. Uniper SE, which the German state agreed to nationalize and which will operate the terminal, said the first tanker carrying LNG will arrive at the start of next year if all goes according to plan.
  • Regulation
  • Fiscal Policy

Glencore Says This Time Is Different for Coming Copper Shortage

AI Summary. Glencore estimates a cumulative gap between projected copper demand and supply of 50m tons through 2030, against current world demand of about 25m tons a year, and argues the industry will not lift supply as it has in previous cycles. The company says copper prices do not yet reflect the coming deficit.

Jack Farchy Bloomberg
Date Posted:
December 9, 2022

Glencore’s CEO forecasts a cumulative gap between projected copper demand and supply of 50mm tons between 2022 and 2030, relative to the current demand of 25mm tons a year. @bloomberg

Glencore’s CEO forecasts a cumulative gap between projected copper demand and supply of 50mm tons between 2022 and 2030,...

Is a large copper deficit coming that prices do not reflect?

Core argument: Glencore CEO Gary Nagle presented estimates showing a cumulative gap between projected copper demand and supply of 50 million tons between 2022 and 2030, compared with current world copper demand of about 25 million tons a year.

Glencore Plc Chief Executive Officer Gary Nagle said that while some people were assuming that the industry would lift copper supplies as it had in previous cycles to meet a forecast increase in demand driven by the energy transition, “this time it is going to be a bit different.” He presented estimates showing a cumulative gap between projected demand and supply of 50 million tons between 2022 and 2030. That compares with the current world copper demand of about 25 million tons a year. “There’s a huge deficit coming in copper, and as much as people write about it, the price is not yet reflecting it,” Nagle said.

Takeaways by Macro Roundup® AI

  1. Glencore CEO Gary Nagle presented estimates showing a cumulative gap between projected copper demand and supply of 50 million tons between 2022 and 2030, compared with current world copper demand of about 25 million tons a year.
  2. Nagle said that while some assume the industry will lift copper supplies as in previous cycles to meet forecast demand growth driven by the energy transition, "this time it is going to be a bit different.".
  3. Nagle said a huge copper deficit is coming and that, as much as people write about it, the price is not yet reflecting it.
  • Financial Markets
  • GDP

Monday, December 12, 2022

How Much Would Creating a Child Allowance Reduce Work Among Parents?

AI Summary. A permanent child allowance resembling the expanded child tax credit could reduce employment among single mothers by about 1m, according to estimates from the Chicago team. That effect would go a long way toward reversing employment gains among single mothers since the welfare policy reforms of the mid-1990s.

Scott Winship American Enterprise Institute
Date Posted:
December 12, 2022
Is Database:
Database

.@swinshi notes that @JacobBastian25’s latest research underestimates the disemployment effects of an enhanced Child Tax Credit. Scott view of the disemployment effects support Bruce Myers and @kefincorinth CTC estimates @UChicago. @aei

.@swinshi notes that @JacobBastian25’s latest research underestimates the disemployment effects of an enhanced Child Tax...

Would a permanent child allowance reduce employment among single mothers?

Core argument: The Chicago team claims a permanent Child Tax Credit expansion resembling the temporary 2021 child allowance could reduce employment among single mothers by about one million, an effect that would go a long way toward reversing their employment gains since the mid-1990s policy reforms.

In his reconciliation of his own results with those of the Chicago team, Bastian misattributes something on the order of 200,000 of the one-million-parent difference in predicted disemployment to married parents rather than to low-income single mothers. Relative to the Chicago team, he underestimates the disemployment of low-income single mothers by a similar amount. The evidence remains consistent with the Chicago team’s claims: a permanent expansion of the CTC that resembles the temporary child allowance created in 2021 could reduce employment among single mothers by about one million, an effect that would go a long way toward reversing the employment gains among single mothers since the policy reforms of the mid-1990s.

Takeaways by Macro Roundup® AI

  1. The Chicago team claims a permanent Child Tax Credit expansion resembling the temporary 2021 child allowance could reduce employment among single mothers by about one million, an effect that would go a long way toward reversing their employment gains since the mid-1990s policy reforms.
  2. Bastian misattributes roughly 200,000 of the one-million-parent difference in predicted disemployment to married parents rather than to low-income single mothers, underestimating disemployment among low-income single mothers by a similar amount.
  3. The evidence remains consistent with the Chicago team's claims about the employment effects of a permanent child allowance, despite Bastian's reconciliation of his own results with theirs.

In Bastrain’s reconciliation of his own results with those of the Bruce Myer’s Chicago team, Bastian misattributes something on the order of 200,000 of the one-million-parent difference in predicted disemployment to married parents rather than to low-income single mothers. Relative to the Chicago team, he underestimates the disemployment of low-income single mothers by a similar amount. The evidence remains consistent with the Chicago team’s claims: a permanent expansion of the CTC that resembles the temporary child allowance created in 2021 could reduce employment among single mothers by about one million, an effect that would go a long way toward reversing the employment gains among single mothers since the policy reforms of the mid-1990s.

Bottom line, “…The evidence remains consistent with the Chicago team’s claims: a permanent expansion of the CTC that resembles the temporary child allowance created in 2021 could reduce employment among single mothers by about one million, an effect that would go a long ways toward reversing the employment gains among single mothers since the policy reforms of the mid-1990s….”

Scott notes three core flaws

“..In his reconciliation of his own results with those of the Chicago team, Bastian misattributes something on the order of 200,000 of the one-million-parent difference in predicted disemployment to married parents rather than to low-income single mothers. Relative to the Chicago team, he underestimates the disemployment of low-income single mothers by a similar amount. This is one reason why Bastian’s results suggest that Corinth et al. have overestimated disemployment effects among upper-income parents..”

“…Bastian’s assumed size for the key parameter in the child allowance debates—the participation elasticity for low-income single mothers, which describes the sensitivity of their employment to changes in the return to work—is almost surely too low. The midpoint of the range of credible elasticities for this group is higher, not lower, than assumed by the Chicago team. Indeed, that midpoint is exactly the same if we only use the elasticities implied by Bastian’s own studies. That makes the Chicago team’s disemployment effects relatively conservative. Bastian’s arguments that recent studies find lower elasticities or that the elasticity for low-income single mothers has fallen substantially over time do not stand up against his own research and that of others….”

“…Of Bastian’s other attempts to invalidate the Chicago team’s results, one suffers from Bastian’s understatement of the disemployment effect on low-income single mothers, one constitutes an illogical exercise in applying averages to subgroups to show results that seem implausible, and one is a markedly imprecise back-of-the-envelope exercise that can easily be modified to reinforce the Chicago team’s results….”

Scott Winship, “How Much Would Creating a Child Allowance Reduce Work Among Parents?,” American Enterprise Institute, December 9, 2022, https://www.aei.org/research-products/working-paper/how-much-would-creating-a-child-allowance-reduce-work-among-parents/

  • Taxation
  • Workforce
    • Unemployment/Participation

Fusion Energy Breakthrough by US Scientists Boosts Clean Power Hopes

AI Summary. US scientists at a federal laboratory achieved net energy gain in a fusion experiment, with a reaction producing about 2.5 megajoules of energy versus the 2.1 megajoules delivered by the lasers, roughly 120%. The facility uses inertial confinement fusion, bombarding a small pellet of hydrogen plasma with the world's largest laser.

Tom Wilson Financial Times
Date Posted:
December 12, 2022

.@ft reports that researchers at the Lawrence Livermore National Laboratory have achieved a net energy gain in a fusion power experiment – producing 2.5 megajoules of energy, about 120 per cent of energy used to trigger the fusion reaction.

Has a fusion experiment produced more energy than it consumed?

Core argument: Lawrence Livermore National Laboratory's fusion experiment produced about 2.5 megajoules of energy from 2.1 megajoules delivered by its lasers, roughly 120% of the input, achieving net energy gain, according to people with knowledge of the results.

The federal Lawrence Livermore National Laboratory in California, which uses a process called inertial confinement fusion that involves bombarding a tiny pellet of hydrogen plasma with the world’s biggest laser, had achieved net energy gain in a fusion experiment in the past two weeks, the people said. The fusion reaction at the US government facility produced about 2.5 megajoules of energy, which was about 120% of the 2.1 megajoules of energy in the lasers, the people with knowledge of the results said, adding that the data was still being analyzed.

Takeaways by Macro Roundup® AI

  1. Lawrence Livermore National Laboratory's fusion experiment produced about 2.5 megajoules of energy from 2.1 megajoules delivered by its lasers, roughly 120% of the input, achieving net energy gain, according to people with knowledge of the results.
  2. Lawrence Livermore National Laboratory, a federal facility in California, uses inertial confinement fusion, bombarding a tiny pellet of hydrogen plasma with the world's biggest laser.
  3. Data from the Lawrence Livermore net energy gain result was still being analyzed, according to the people with knowledge of the results.
  • Innovation/Research
  • Productivity

End of the Road

AI Summary. The US Energy Information Administration projects utility-scale battery storage capacity will rise from 1.5 GW to 30.0 GW over five years, outpacing utility-scale solar's early expansion from under 1.0 GW to 13.7 GW. New wind and solar costs roughly $28–$30/MWh without storage versus $45–$74/MWh for natural gas, which offers higher grid value.

Gregor Macdonald The Gregor Letter
Date Posted:
December 12, 2022

.@GregorMacdonald notes a new EIA report that reports “US battery storage capacity is outpacing even the early growth of the country’s utility-scale solar capacity.”

Is US battery storage growing faster than solar's early expansion?

Core argument: The EIA expects US utility-scale battery storage capacity to rise from 1.5 GW in 2020 to 30.0 GW in 2025, outpacing the early growth of utility-scale solar.

The growth rate of US utility-scale battery storage capacity is outpacing the early growth rates seen in utility scale solar. That’s according to a new EIA outlook on grid-level storage: “The remarkable growth in US battery storage capacity is outpacing even the early growth of the country’s utility-scale solar capacity. US solar capacity began expanding in 2010 and grew from less than 1.0 GW in 2010 to 13.7 GW in 2015. In comparison, we expect battery storage to increase from 1.5 GW in 2020 to 30.0 GW in 2025.” New wind and solar + storage is probably at the current line of scrimmage with new natural gas. The former comes in around $28-$30/MWh without storage, and the latter comes in around $45-$74/MWh. But natural gas has higher value to the grid compared to wind and solar when they’re not paired with storage.

Takeaways by Macro Roundup® AI

  1. The EIA expects US utility-scale battery storage capacity to rise from 1.5 GW in 2020 to 30.0 GW in 2025, outpacing the early growth of utility-scale solar.
  2. US utility-scale solar capacity grew from less than 1.0 GW in 2010 to 13.7 GW in 2015, a slower early expansion than the EIA projects for battery storage.
  3. Wind and solar without storage come in around $28–$30/MWh versus roughly $45–$74/MWh for new natural gas, though natural gas has higher value to the grid than wind and solar unpaired with storage.
  • Innovation/Research
  • Productivity

The Temptation to Call the End of Inflation

AI Summary. Estimates of global new liquidity show three-month annualized growth in the monetary base ticking up slightly after falling to its lowest level since the global financial crisis, with major advanced economies rebounding from negative growth as a falling US dollar eases conditions worldwide, suggesting a pivot away from tighter money may be under way.

John Authers Bloomberg
Date Posted:
December 12, 2022
Is Database:
Database

.@johnauthers reports that we may have seen a trough in global liquidity, according to data from Crossborder Capital.

Is global liquidity growth turning up after reaching post-crisis lows?

Core argument: Balance sheet data from major central banks show policy liquidity shrinking at 5.3% in local currency terms but rising 2.7% in US dollar terms.

The above chart by Michael Howell of Crossborder Capital shows estimates of global new liquidity. The lines indicate the three-month annualized % growth in the monetary base. Globally [red line], growth in liquidity has ticked up very slightly after dropping to its lowest level since the global financial crisis. In the major G10 economies [grey and yellow], there is a pickup from outright negative growth that has been helped by the startling fall in the US dollar in recent weeks. As many countries use dollar financing, this has the effect of easing conditions everywhere. Last week’s balance sheet data from major central banks show policy liquidity shrinking at 5.3% in local currency terms [yellow] but rising by 2.7% in US dollar terms [grey.] Thus, it is possible that a pivot away from tighter money is already under way.

Takeaways by Macro Roundup® AI

  1. Balance sheet data from major central banks show policy liquidity shrinking at 5.3% in local currency terms but rising 2.7% in US dollar terms.
  2. Global liquidity growth, measured as three-month annualized growth in the monetary base, has ticked up slightly after falling to its lowest level since the global financial crisis, per Crossborder Capital estimates.
  3. Liquidity growth in the major G10 economies has picked up from negative territory, helped by the fall in the US dollar, which eases conditions broadly because many countries use dollar financing, raising the possibility that a pivot away from tighter money is under way.

“…The above chart by Michael Howell of Crossborder Capital shows estimates of global new liquidity. The lines indicate the three-month annualized % growth in the monetary base. Globally [red line], growth in liquidity has ticked up very slightly after dropping to its lowest level since the global financial crisis. In the major G10 economies [grey and yellow], there is a pickup from outright negative growth that has been helped by the startling fall in the US dollar in recent weeks. As many countries use dollar financing, this has the effect of easing conditions everywhere. Last week’s balance sheet data from major central banks show policy liquidity shrinking at 5.3% in local currency terms [yellow] but rising by 2.7% in US dollar terms [grey.] Thus, it is possible that a pivot away from tighter money is already under way…”

John Authers, “The Temptation to Call the End of Inflation,” Bloomberg, December 11, 2022, https://www.bloomberg.com/opinion/articles/2022-12-12/john-authers-calling-the-end-of-inflation-and-buying-china?sref=U3dOGIDF

The Temptation to Call the End of Inflation

Lead Us Not Into Inflation

What have we got to be afraid of? The 2022 drama of the word’s fight against the return of inflation is about to reach its final act. After the US consumer price index on Tuesday, the Federal Reserve holds its last monetary policy meeting for the year on Wednesday, to be followed the next day by the European Central Bank, Bank of England, Swiss National Bank, and Norway’s Norges Bank. Then finally, with any luck, we can all enjoy the World Cup final and send the world into mothballs for the Christmas and New Year holidays.

So where do we stand? Inflation this year far exceeded any estimate, as did the monetary policy response (at the turn of the year, fed funds futures predicted the fed funds rate would hit 0.82% after this week’s meeting; now that market is braced for 4.35%). But after the ghastly surprise of 2022, markets again are coalescing around a view that price rises will imminently come under control. That is clear if we look at implied inflation rates from the swaps market (available on the terminal), which suggest that CPI will be back below 3% by next summer:

Why might they think this? We can answer that first by reference to the broader global picture, and then by looking more closely at the nitty-gritty of central banks’ provision of liquidity to the markets. For the case that it’s reasonable to expect inflation to fall next year, consider this schematic illustration from Academy Securities’ Peter Tchir:

Don’t spend any time on the precise numbers, or the way the different factors have been weighted; this is meant as an aid to thought and conjecture rather than anything precise. Inflation had many driving factors behind it. Among the most important were: The Fed’s expansive monetary policy in 2020 and 2021 (“The Fed” above); the fiscal stimulus administered to tide companies and individuals through the pandemic (“Stimulus”); stresses on global supply chains as businesses began to reopen; the war in Ukraine; and the bubbly behavior that was fostered by the brief but dramatic boom in “disruptive” stocks and cryptocurrencies. The diagram shows Tchir’s rough estimate of how important all these factors have been since the pandemic began. At this point, his model suggests that the Ukraine conflict is the only remaining factor still pushing inflation upwards. By the middle of next year, again on a very simple model, all of the previously inflationary forces will have become deflationary. Intuitively, this model does seem reasonable. It also implies, for Tchir, that the Fed has already gone too far.

If that’s concerning, we also need to look at how far the battle to tame in inflation has come. Central banks across the world have reined in liquidity this year, and the announced policy of “quantitative tightening” implies that they have much further to go, selling bonds into the market to reduce the money in circulation. However, it looks as though this may already have come to a “pivot” point. The following chart by Michael Howell of Crossborder Capital in London shows estimates of global new liquidity:

To be precise, the lines indicate the three-month annualized percentage growth in the monetary base. Globally, growth in liquidity has ticked up very slightly after dropping to its lowest level since the global financial crisis. In the major G10 economies, there is a pickup from outright negative growth that has been helped by the startling fall in the US dollar in recent weeks. As many countries use dollar financing, this has the effect of easing conditions everywhere. Last week’s balance sheet data from major central banks show policy liquidity shrinking at 5.3% in local currency terms but rising by 2.7% in US dollar terms. Thus, it is possible that a pivot away from tighter money is already under way.

The weakening of the dollar can be viewed as a response to implicit easing by the Fed, or it might also have been driven by an increasing belief that inflation really has been licked, and that tightening will soon go into reverse. By trying to anticipate this, the foreign exchange market almost delivers some degree of easier money as a self-fulfilling prophecy. Even if the Fed has already tightened too far, then, it’s possible that markets are already working to blunt the impact on the economy next year. To quote Howell of Crossborder Capital: ‘The US Federal Reserve looks to be leading the cycle once again. Having been the first to tighten starting from around this time last year, recent data suggest that the Fed’s QT cycle is close, or even already at, its nadir. Interest rates are likely to go on rising into 2023, albeit at a slower pace as upward pressure on prices abates, but quantitative policy looks to be changing direction already. The US dollar is responding. From its recent peak levels, it has lost some 14% versus sterling, around 10% against the euro and yen, and 5% versus the renminbi. While other Central Banks may lag the Fed once again, the depreciation of the US dollar will help. Its strength during 2022 has forced EM Central Banks to tighten to underpin their own currencies and has exacerbated already strong inflationary pressures in Western economies. The positive effect is already evident in aggregate policy liquidity growth expressed in US dollar terms. This is now gently expanding having been in negative territory for the last 12 months.”

A broader question concerns the pressures that sustain longer-term inflation. Many of the big global trends driving prices higher have turned, but consumers and businesses across the world have begun to growing accustomed to rising prices. What risk does this create of a self-perpetuating cycle of rising wage demands and rising prices? That’s an imponderable question, but the continuing strength of the US labor market suggests that inflation isn’t beaten yet. Last week, brought publication of the Atlanta Federal Reserve’s Wage Tracker figures for November, which are based on census data and allow a granular look at pay increases across the US.

Average hourly earnings data from the Bureau of Labor Statistics at the beginning of this month also suggest that it’s premature to call a top on rising wages:

We’re about to receive a bombardment of new information about inflation. It will all be useful, but there are longer-term trends whose destination is unclear. Even if and when the central banks reach the point of not raising rates anymore, there will be plenty more uncertainties.

Buy China?

If there’s one almost universally popular call for 2023, it’s “buy China” — not just its bonds, but even its beleaguered stocks. On any simple what-goes-down-must-come-up model, this makes ample sense. China’s stock market endured almost a perfect storm in 2022: Growing trade conflict with the US, and international outrage of corporate governance, contributed to a selloff that widespread shutdowns caused by the Covid-Zero policy would likely have caused in any case. Once Chinese stocks are in a slough of despond, all good contrarians know that it is time to buy.

However, a lot of the bounce has happened in the last two months. Chinese American Depositary Receipts, as measured by the Bank of New York’s index, and Hong Kong-quoted shares covered by the MSCI China Index have more or less caught up with the MSCI All-World index. An epochal 46% fall for the ADRs at one point is now a more manageable 18% drop for the year. Meanwhile, mainland shares represented by the CSI 300 Index have also regained much ground:

Was that the buying opportunity? What case is there for renewed excitement about China? And can we be sure of the ground we stand on? This time last year, JPMorgan Chase & Co.’s much-quoted equity strategist Marko Kolanovic said: “China was a headwind for performance of various assets this year, but we believe China growth will accelerate in 2022, which should further provide support for global equities and cyclical assets.” JPMorgan’s precise prediction was a for a 38% rise in the MSCI China. As the chart shows, that didn’t happen. It’s as well to remember this when looking at Kolanovic’s outlook for China for 2023: “We remain positive on China, due to favorable monetary conditions as well as an eventual full reopening and end of Covid.” There’s certainly a much more attractively priced entry point now than there was a year ago”

Meanwhile, Christopher Wood, a veteran analyst of Asian markets who writes as GREED & Fear for Jefferies, suggests that it’s now safe to enter the water. But it’s important than he is more confident about relative performance (because he sees US earnings and the dollar as challenged), than about absolute performance in an environment that is likely to see a big public health crisis in the next few months: “The growing evidence of further closet Covid easing this week is clearly bullish for Chinese equities and increases the chance that the emerging market asset class has made a major bottom against both the S&P500 and the MSCI World Index. This is particularly the case given the positive earnings upgrade potential for several Asian markets next year and the risk of earnings downgrades in the US in 2023. Global asset allocators should increase their allocation to emerging markets if they agree with GREED & fear’s base case, namely that monetary tightening expectations and the US dollar have peaked.”

There’s a big currency element to this. China’s yuan has enjoyed a dramatic resurgence in the last two months, driven both by lower yields in the US and hopes that post-Covid opening is real and imminent. It’s dropped below 7.0 per dollar — a level that has caused major political tensions in the past — after one of its strongest appreciations in decades:

In its own right, a rebound after a major selloff makes sense for the yuan. But all the China bulls might take note that this big shift has already happened, and might easily reverse if the post-Covid resumption does not go as hoped. It’s worth heeding these words from Marc Chandler of Bannockburn Global Forex: “The US 10-year yield premium over China topped in late October at slightly more than 150 bp. It fell to almost 50 bp last week before settling around 65 bp. Investors have been eager to believe the Covid pivot, but the risk is that they have gotten ahead of themselves. Of course, less testing will generate less detected cases but there will be other signs of rising infections and strains on the healthcare system. That said, even if one wants to accept these developments at face value, the move is too far too fast. The yuan’s surge offers an opportunity to those who are looking for an opportunity to hedge or reduce CNY exposure.”

China is plainly a more interesting investment opportunity than it was 12 months ago. But, just as then, the case might not be quite as clear as it seems.

  • Financial Markets
  • GDP
    • Inflation
  • Monetary Policy

A Sharper Signal Amid the Noise

AI Summary. Corporate deleveraging is cyclical, with a higher proportion of companies paying down debt when the economy slows and spikes in recessions. Among the decile of companies most likely to deleverage, the share that actually paid down debt stayed within a 60%–80% band across a 50-year sample spanning inflation spirals, stock bubbles, and financial crises.

Brian Chingono Verdad
Date Posted:
December 12, 2022

Brian Chingone of @verdadcap notes that deleveraging is cyclical, with firms paying down debt as the economy slows.

Does corporate debt paydown follow a predictable pattern across economic cycles?

Core argument: Among Decile 10 companies with the highest likelihood of deleveraging, actual deleveraging outcomes stay within a consistent 60–80% band over a 50-year sample spanning inflation spirals, stock market bubbles, and financial crises.

Deleveraging is cyclical, with a higher proportion of companies paying down debt when the economy is slowing down. The figure above illustrates this process among Decile 10 companies that have the highest likelihood of deleveraging. The solid line represents actual deleveraging, and we can see spikes in the proportion of companies that pay down debt during recessions. Another important implication of the chart above is that deleveraging outcomes in the top decile remain within a consistent band between 60% and 80% over a 50-year sample that includes a range of macro environments, from inflation spirals to stock market bubbles to financial crises.

Takeaways by Macro Roundup® AI

  1. Among Decile 10 companies with the highest likelihood of deleveraging, actual deleveraging outcomes stay within a consistent 60–80% band over a 50-year sample spanning inflation spirals, stock market bubbles, and financial crises.
  2. Deleveraging is cyclical, with a higher proportion of companies paying down debt when the economy slows, and actual deleveraging spikes during recessions.
  • Business Cycle
  • GDP
    • Financial Markets

Booming Chinese Family Offices Recruit Top Bankers in Singapore

AI Summary. Wealthy mainland Chinese moving assets out of China account for up to half of the increase in Singapore-based single-family offices, private wealth managers for rich individuals and their relatives, whose numbers have nearly tripled since the coronavirus pandemic began to an estimated 1,500. Singapore has tightened rules with higher minimum capital and hiring requirements.

Mercedes Ruehl and Leo Lewis Financial Times
Date Posted:
December 12, 2022

Mainland Chinese moving assets out of China account for half of the 1,500 Singapore-based single-family offices. @ft

Mainland Chinese moving assets out of China account for half of the 1,500 Singapore-based single-family offices. @ft

Are wealthy Chinese driving Singapore's family office boom?

Core argument: Singapore-based single-family offices have risen nearly threefold since the start of the coronavirus pandemic, totaling as many as 1,500 by some estimates.

Wealthy mainland Chinese moving assets out of President Xi Jinping’s China account for up to half of a rise in Singapore-based single-family offices — the private wealth management firms set up for rich individuals and their relatives. Numbers have jumped nearly threefold since the coronavirus pandemic began and, according to some estimates, now total as many as 1,500. Caught by surprise by the surging numbers of family office funds, Singapore’s government this year tightened the rules, with higher minimum capital and hiring requirements.

Takeaways by Macro Roundup® AI

  1. Singapore-based single-family offices have risen nearly threefold since the start of the coronavirus pandemic, totaling as many as 1,500 by some estimates.
  2. Wealthy mainland Chinese moving assets out of Xi Jinping's China account for up to half of the increase in Singapore-based single-family offices.
  3. Singapore's government, caught by surprise by the surging number of family office funds, tightened the rules with higher minimum capital and hiring requirements.
  • Savings Glut/Trade Deficit
  • China
  • GDP

Japan to Join US Effort to Tighten Chip Exports to China

AI Summary. Japan and the Netherlands agreed in principle to join the US in restricting exports of advanced chipmaking equipment to China, creating what would amount to a near-total blockade on China's ability to buy the tools needed for leading-edge chips. Japan's Tokyo Electron and Dutch lithography maker ASML are critical suppliers alongside US firms Applied Materials, Lam Research and KLA.

Takashi Mochizuki, Cagan Koc, and Peter Elstrom Bloomberg
Date Posted:
December 12, 2022

In what @bloomberg describes as “a near-total blockade,” Japan and the Netherlands have “agreed in principle” to join new export controls on China, which would limit access to equipment from Japan’s Tokyo Electron Ltd and the Dutch lithography firm ASM.

In what @bloomberg describes as “a near-total blockade,” Japan and the Netherlands have “agreed in principle” to join new...

Will allies joining US export controls block China's chipmaking equipment access?

Core argument: Japan and the Netherlands have agreed in principle to join the US in tightening export controls on advanced chipmaking machinery to China, according to people familiar with the matter.

Japan and the Netherlands have agreed in principle to join the US in tightening controls over the export of advanced chipmaking machinery to China, according to people familiar with the matter, a potentially debilitating blow to Beijing’s technology ambitions. The three-country alliance would represent a near-total blockade of China’s ability to buy the equipment necessary to make leading-edge chips. The US rules restricted the supply from American gear suppliers Applied Materials Inc., Lam Research Corp. and KLA Corp. Japan’s Tokyo Electron Ltd. and Dutch lithography specialist ASML Holding NV are the two other critical suppliers that the US needed to make the sanctions effective, making their governments’ adoption of the export curbs a significant milestone.

Takeaways by Macro Roundup® AI

  1. Japan and the Netherlands have agreed in principle to join the US in tightening export controls on advanced chipmaking machinery to China, according to people familiar with the matter.
  2. The three-country alliance would represent a near-total blockade of China's ability to buy the equipment necessary to make leading-edge chips, a potentially debilitating blow to Beijing's technology ambitions.
  3. US rules restricted supply from Applied Materials, Lam Research and KLA, leaving Japan's Tokyo Electron and Dutch lithography specialist ASML as the two other critical suppliers needed to make the sanctions effective.
  • Trade (not deficits)
  • China
  • GDP


Loading More Posts

End of content

No more pages to load

© Copyright 2026 Coherent Research Institute · All Rights Reserved · Privacy · Terms