Edward Conard

Top Ten New York Times Bestselling Author

  • “Unintended Consequences provides a provocative interpretation of the causes of the global financial crisis and the policies needed to return to rapid growth. Whether you agree or not, this analysis is well worth reading.” - Nouriel Roubini, New York University; Chairman, Roubini Global Economics
  • “…a very valuable contribution.” - Larry Summers, former Secretary of the Treasury and director of the National Economic Council, president emeritus, Harvard University
  • “…a fresh argument for the productive value of inequality.” - David Autor, Professor of Economics, Massachusetts Institute of Technology
  • “Unintended Consequences should be read by anyone who takes for granted the superiority of progressive taxation and has not thought carefully about the trade-offs involved.” - The New Republic
  • “…challenges misconceptions that distort our economic debates.” - Arthur Brooks, President of the American Enterprise Institute
  • “Unintended Consequences represents the most cogent and persuasive analysis of the Financial Crisis to date.” - Andrei Shleifer, 1999 John Bates Clark Medal Winner
  • “…a must-read for serious students of economic policy.” - Glenn Hubbard, Dean, Columbia Business School, and former Chairman of the Council of Economic Advisers
  • “…a fresh argument for the productive value of inequality.” - David Autor, Professor of Economics, Massachusetts Institute of Technology
  • “A full-throated defense of economic dynamism.” - The Wall Street Journal
  • “…serious thinking for serious thinkers. …a thought-provoking blueprint for growing middle- and working-class incomes.” - Mitt Romney, former Governor of Massachusetts
  • “…a very valuable contribution.” - Larry Summers, former Secretary of the Treasury and director of the National Economic Council, president emeritus, Harvard University
  • “…a comprehensive explanation of the modern economy.” - Julian Robertson, Founder, Tiger Management
Upside of Inequality Oxford Unintended Consequences
Buy the Books
  • Macro Roundup
  • About Roundup
  • About Ed Conard
  • Highlights
  • Topics
  • Subscribe
Edward Conard
  • twitter
  • facebook
  • linkedin
  • youtube

Macro Roundup

  • Email
  • Text Message (SMS)
  • Twitter/X
  • LinkedIn
  • Facebook
  • WhatsApp Message
Subscribe to Macro Roundup Emails
Select topics to choose: articles that mention them (broader) or articles mainly about them (focused)
  • Mentions 0
  • Primary focus 0
Showing all 7,320 Macro Roundup articles
When you search for any topic (like GDP, Inflation, or Banking), choose:
Choose search scope

Thursday, September 29, 2022

U.S. government debt is not a ticking time bomb

AI Summary. Paying 3.5% interest on debt worth 120% of GDP imposes a burden comparable to the mid-1990s, when rates were near 7% and debt was about half as large relative to GDP. With the Federal Reserve expected to cut rates and inflation eroding the debt's real value, interest costs are projected to rise but remain manageable.

Noah Smith Noahpinion
Date Posted:
September 29, 2022
Is Database:
Database

Paying 3.5% interest on 120% of GDP is comparable to borrowing costs in the mid-1990s, when interest rates were around 7%.

Is the interest burden on government debt still manageable?

Core argument: Paying 3.5% interest on U.S. debt equal to 120% of GDP is comparable to borrowing costs in the mid-1990s, when interest rates were around 7% and debt was about half as large relative to GDP.

Paying 3.5% interest on 120% of GDP is comparable to borrowing costs in the mid-1990s, when interest rates were around 7%. Despite the U.S. debt being about twice the size relative to GDP compared to the 90s, the current interest rate environment is not as dire as it seems. The Federal Reserve anticipates cutting rates, which will moderate interest costs. Inflation is also eroding the debt, reducing its real value over time. Consequently, while interest costs are expected to rise, they are not projected to reach catastrophic levels. Instead, they may return to mid-90s levels, which is manageable. This suggests that U.S. government debt is not a ticking time bomb, although some fiscal austerity may be prudent to manage future costs effectively.

Takeaways by Macro Roundup® AI

  1. Paying 3.5% interest on U.S. debt equal to 120% of GDP is comparable to borrowing costs in the mid-1990s, when interest rates were around 7% and debt was about half as large relative to GDP.
  2. The Federal Reserve is expected to cut rates, which would moderate U.S. interest costs, while inflation erodes the real value of outstanding debt over time.
  3. U.S. interest costs are projected to rise but not to catastrophic levels, instead returning toward manageable mid-1990s levels, though some fiscal austerity may be prudent.

"..we’ll have to roll over about half of our government debt over the next 4 years or so. And we’ll have to roll it over at higher interest rates. So far, yields are only back up to the levels of the mid-2000s, and not yet back to 90s levels. But there are two problems here: Borrowing costs might go up more, as the Fed is forced to hike interest rates more and more in order to bring inflation down. We have to pay interest on a much bigger pile of government debt than we did in the 90s and 2000s…. As a percentage of GDP, our debt is about twice what it was in the halcyon days of the 90s and early 00s. That means paying 5% interest on that debt would be as costly as paying 10% interest would have been back in 1995 or 2005. (The story is similar if you look at debt as a percent of tax revenues.) So if something doesn’t change in the next 4 years or so, we could easily be paying 80s levels of interest costs on the federal debt….In the 80s, interest costs reached an astounding 50% of tax revenue! …Two silver linings So why am I not alarmed? Well, two reasons. First, interest rates probably aren’t going to stay high for that long. The Fed currently predicts that it will start cutting rates in 2023. And markets expect this to happen too:This will moderate the rise in interest costs a bit. Paying 3.5% interest on 120% of GDP will only be as painful as paying 7% interest would have been in the 90s. And in fact borrowing costs were about that high in the mid-90s. So this really isn’t too bad. And if inflation drops back to pre-pandemic levels, we can lower interest rates even more. The second reason for calm is that inflation itself is eroding the debt. Notice how government debt as a percent of GDP has been going down for the last couple of years? Part of that is GDP growth, but part of that is just inflation. The government kept borrowing money, but the entire existing debt stock was shrinking in real terms. The result is that in inflation-adjusted terms, government debt didn’t even rise in 2021 or 2022: In other words, we’re going to exit the current inflationary era with more expensive debt, but on a somewhat smaller amount of debt. And that debt erosion is permanent, even though higher interest rates will probably be temporary.Therefore I do see increased interest costs in our future, but not as apocalyptic as Druckenmiller says. A return to the costs of the mid-90s seems reasonable….”

Noah Smith, "U.S. government debt is not a ticking time bomb,"Noahpinion, September 29, 2022, https://noahpinion.substack.com/p/us-government-debt-is-not-a-ticking

U.S. government debt is not a ticking time bomb

Some folks asked me to write a post about whether the U.S. debt is a ticking time bomb. They were alarmed by this viral video of retired hedge fund manager Stanley Druckenmiller declaring that U.S. debt service costs are about to eat the rest of the budget:

U.S. government debt is not a ticking time bomb: Extended Excerpt Image 1


Now, Druckenmiller is not a perennial prophet of doom and gloom, nor is he a perma-hawk who always warns that deficits and/or inflation are about to destroy the economy. He correctly warned of inflation as early as September 2020, but he does not appear to be one of the people who (wrongly) warned that quantitative easing would cause inflation back in the early 2010s. A lot of finance-industry macro guys will tell the crowd what they want to hear, but Druckenmiller seems like a straight shooter.

What’s more, some of his concerns are clearly appropriate. Higher interest rates will raise the amount of money that the U.S. government has to spend on debt service, and that will crowd out other types of government spending. And in the long run, we will probably have to either make cuts to entitlement benefits or find significant new sources of cost reduction, which can be a politically tricky thing to do.

Personally, though, I think things aren’t nearly as bad as Druckenmiller thinks. U.S. interest costs won’t rise catastrophically in the short term, and there’s not really a reason to expect interest rates to stay high for decades. Furthermore, inflation will itself erode some of the national debt, reducing long-term interest costs relative to GDP.

It does seem clear, though, that increased interest costs — and the Fed’s unwillingness to finance higher government borrowing — will force a bit of austerity in the years to come.

Interest costs are going up, but it’s not that bad yet

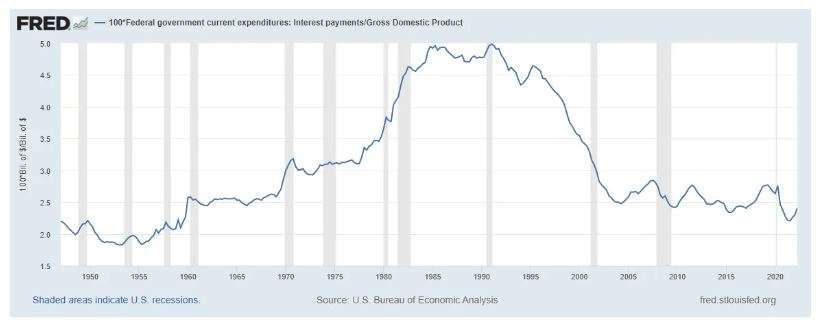
Here’s a long-term history of how much the federal government pays in interest payments, as a percent of GDP:

U.S. government debt is not a ticking time bomb: Extended Excerpt Image 2


You can see that interest costs fell during and after the pandemic and have now started to rise again. But they’re a long way from being anywhere close to what they were in the 1980s, when they reached almost 5% of GDP.

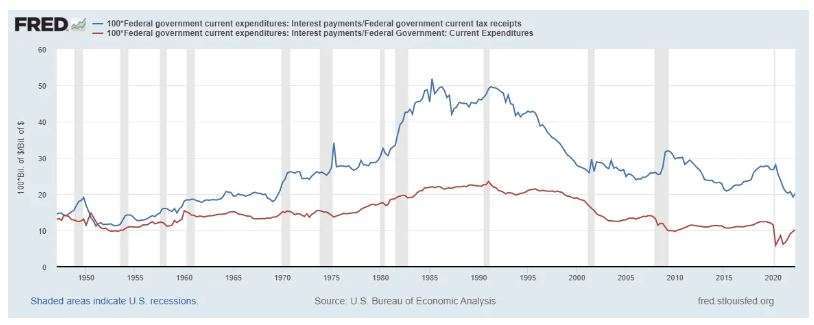
Now let’s look at interest payments as a percent of tax revenue and as a percent of government spending:

U.S. government debt is not a ticking time bomb: Extended Excerpt Image 3


In the 80s, interest costs reached an astounding 50% of tax revenue! This is because we raised interest rates in the 80s while also cutting taxes. For better or for worse, Reagan was not a particularly fiscally responsible President.

Right now, interest payments haven’t even begun to rise as a percent of tax revenue, and one big reason is inflation. Interest rates are set in dollar amounts, and inflation increases the number of dollars in the economy, meaning that tax revenues increase in dollar terms as well. That makes it easier for the government to make its interest payments. Remember, inflation erodes debt of all kinds.

The problem: rolling over the debt

So right now, interest costs are fine. But if interest rates keep going up, then interest costs will rise. The reason is that the U.S. government has to roll over its debt as the bonds reach maturity. And as it rolls over debt, it will have to borrow at a higher interest rate.

Now, this doesn’t happen all in one fell swoop. Not all of our government debt has to be rolled over immediately. If the government issued a 20-year bond in 2020 at near 0% interest rates, interest costs on that debt won’t go up for 18 more years. Right now, we have a bunch of outstanding bonds that were all issued at different times, and at different maturities. Figuring out how fast our existing debt needs to be rolled over actually takes some serious work.

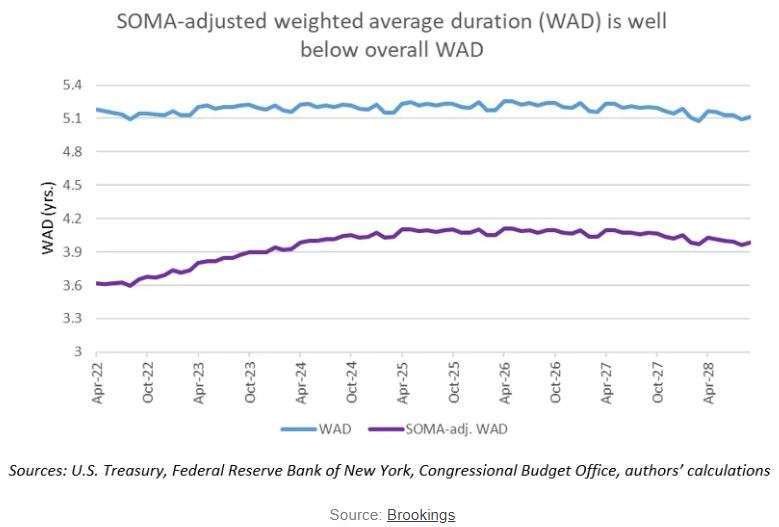
Fortunately, a team at Brookings has recently done this work. They found that the weighted average duration (WAD) of outstanding Treasury debt is a little over 5 years. And when you count “SOMA” debt that the Treasury owes to the Fed (which you probably should, since the Fed isn’t going to forgive that debt), the weighted average duration is only about 4 years.

U.S. government debt is not a ticking time bomb: Extended Excerpt Image 4


It seems like a big mistake to me that we didn’t borrow at longer maturities to lock in low interest rates for a very long time. In fact, we kept making this mistake right into the spring of 2021, when inflation had already started to accelerate. Had we had the foresight to lock in low rates for decades, we would be facing much less of an interest cost problem in the 2020s. But anyway, here we are.

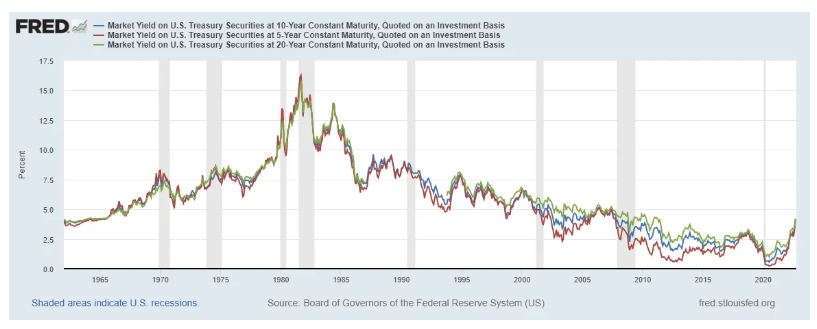
So we’ll have to roll over about half of our government debt over the next 4 years or so. And we’ll have to roll it over at higher interest rates. Here’s a historical chart of yields for 5-year, 10-year, and 20-year Treasury bonds, just to give you an idea of what we’re facing:

U.S. government debt is not a ticking time bomb: Extended Excerpt Image 5


In historical terms, this really doesn’t look that bad. So far, yields are only back up to the levels of the mid-2000s, and not yet back to 90s levels. But there are two problems here:

Borrowing costs might go up more, as the Fed is forced to hike interest rates more and more in order to bring inflation down.

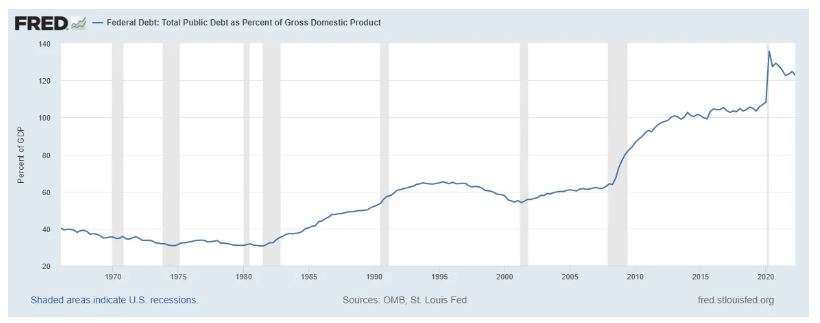
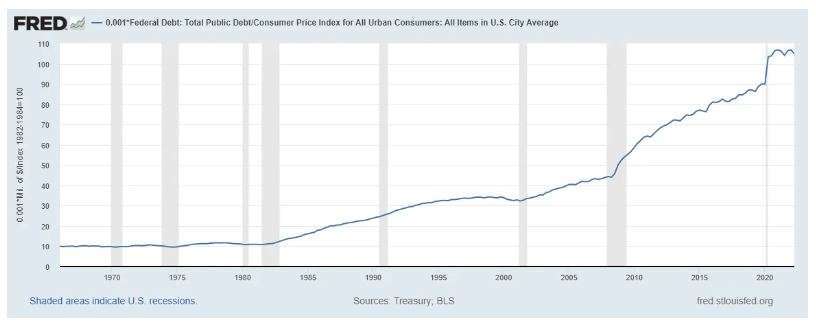
We have to pay interest on a much bigger pile of government debt than we did in the 90s and 2000s. Here’s government debt as a percent of GDP:

U.S. government debt is not a ticking time bomb: Extended Excerpt Image 6


As a percentage of GDP, our debt is about twice what it was in the halcyon days of the 90s and early 00s. That means paying 5% interest on that debt would be as costly as paying 10% interest would have been back in 1995 or 2005. (The story is similar if you look at debt as a percent of tax revenues.)

So if something doesn’t change in the next 4 years or so, we could easily be paying 80s levels of interest costs on the federal debt. In this sense, Druckenmiller’s warning is right.

Two silver linings

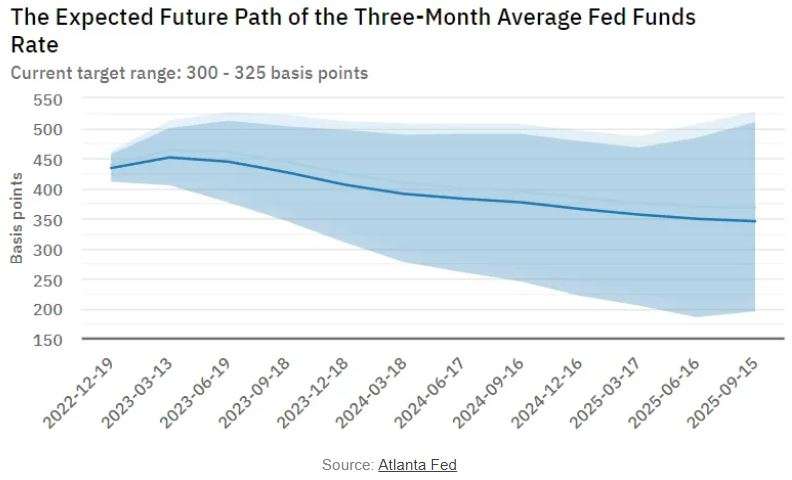
So why am I not alarmed? Well, two reasons. First, interest rates probably aren’t going to stay high for that long. The Fed currently predicts that it will start cutting rates in 2023. And markets expect this to happen too:

U.S. government debt is not a ticking time bomb: Extended Excerpt Image 7


This will moderate the rise in interest costs a bit. Paying 3.5% interest on 120% of GDP will only be as painful as paying 7% interest would have been in the 90s. And in fact borrowing costs were about that high in the mid-90s. So this really isn’t too bad. And if inflation drops back to pre-pandemic levels, we can lower interest rates even more.

The second reason for calm is that inflation itself is eroding the debt. Notice how government debt as a percent of GDP has been going down for the last couple of years? Part of that is GDP growth, but part of that is just inflation. The government kept borrowing money, but the entire existing debt stock was shrinking in real terms. The result is that in inflation-adjusted terms, government debt didn’t even rise in 2021 or 2022:

U.S. government debt is not a ticking time bomb: Extended Excerpt Image 8


In other words, we’re going to exit the current inflationary era with more expensive debt, but on a somewhat smaller amount of debt. And that debt erosion is permanent, even though higher interest rates will probably be temporary.

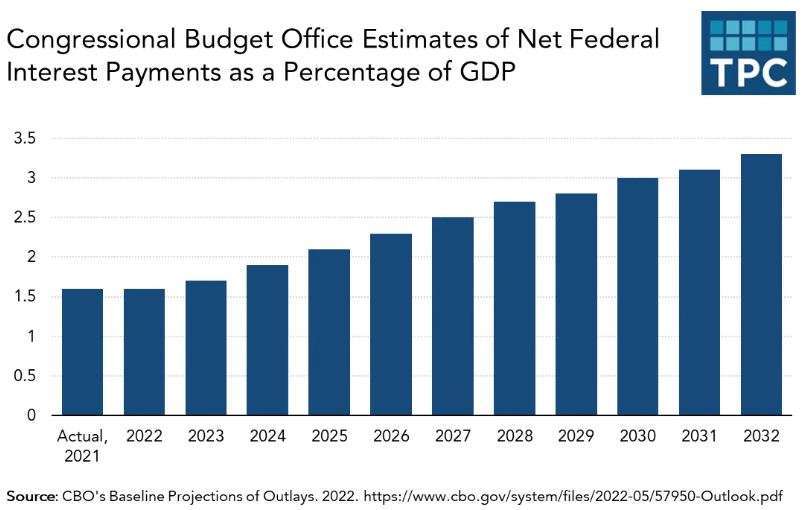
Therefore I do see increased interest costs in our future, but not as apocalyptic as Druckenmiller says. A return to the costs of the mid-90s seems reasonable. And in fact, this is exactly what the Congressional Budget Office projected, back in May:

U.S. government debt is not a ticking time bomb: Extended Excerpt Image 9


That’s not exactly a ticking time bomb.

But although I don’t think we’re headed for a debt-service catastrophe, I do think it would be wise to engage in a little bit of fiscal austerity over the coming decade.

A little bit of austerity won’t hurt

Fiscal austerity will accomplish a couple of purposes. First, it’ll help hold down debt service costs, and second, it will help bring inflation down faster.

During the long slow recovery from the financial crisis and the Great Recession, “austerity” became a dirty word, and with good reason. With borrowing costs ultra-low and the economy far below its potential, there was every reason to borrow cheaply and spend on fiscal stimulus, and countries that chose to ignore this imperative tended to suffer as a result.

But now, a decade later, the situation has changed entirely — the economy is running hot, borrowing costs are higher and rising, and inflation is the big problem. Both basic Keynesian theory and financial reality say that in the current situation, the government should cut back. The UK is now finding out what can happen when a government pushes its fiscal luck too far. We’re in a stronger place than the UK, but that doesn’t mean we’re infinitely strong. Cutting back a bit is only prudent.

But what spending can we cut?

First, let’s talk about entitlements. Most of this is Social Security, Medicare, and Medicaid. When folks like Druckenmiller warn of the dangers of long-term debt, they often talk about how entitlements are projected to explode in cost. The CBO is sort of complicit in this, as it regularly releases deficit projections that show debt going up exponentially starting any day now.

But these projections always assume two things: First, that we won’t cut Social Security, and second, that health care costs will keep increasing at historic rates. Neither of these is likely to be true. They say Social Security is the third rail of politics, but when the system was about to become unsustainable in the past, we quietly raised the retirement age. It’s likely that we’ll do this again. As for health costs, these are a problem whether they’re paid by the private sector or the public sector. But as it happens, health costs as a percentage of GDP have leveled off recently. So it’s quite possible — even likely — that the age when health care costs went up and up has come to an end.

But if entitlements aren’t really going to eat the economy, they also probably won’t get cut by very much. Nor will other social spending, much of which is also health care. If we can bring down health care costs, that will be a big deal (and I’ll talk a lot about this in an upcoming post). But it’s unlikely that we’ll slash government health benefits outright.

And as much as we’d all like to live in an era of peace, defense spending will also have to go up, due to the return of great-power conflict. We need to not only replenish the munitions we’ve been sending to Ukraine, but also bolster our forces for the possibility of an imminent conflict over Taiwan, as well as raise spending on the military modernization efforts that we’re undertaking to match Chinese power in the 2030s.

So if social spending is going to hold steady and defense spending are going to increase, how do we get austerity? The answer is “taxes”. Since World War 2, federal tax revenue has fluctuated between about 15% and 20% of GDP. We’re now at the middle of that range. So we’re going to have to go to the top of that range for a little while.

Higher taxes are painful, and much of that pain will inevitably be borne by the middle class as well as the rich. But that’s the cost of maintaining a welfare state while also protecting the country against external threats. Having a nation is simply an expensive proposition. For a long time, rock-bottom interest rates let us get away with ignoring that cost. That era is now over.

  • Government Spending
  • Fiscal Policy
    • Fiscal Deficits
    • Taxation

Thursday, October 13, 2022

The Sages of Wall Street

AI Summary. US securities analysts overestimated cumulative revenue growth by 4.3% at a 2-year horizon and 4.6% at 3 years, with larger errors for pre-tax earnings at 28.4% and 36.8%. The overshooting is greatest for measures further down the income statement and further out in time.

Brian Chingono Verdad
Date Posted:
October 13, 2022
Is Database:
Database

Analysts consistently overestimated 2-year cumulative revenue growth forecasts by 4.3% and 3-year forecasts by 4.6% from 1997 to 2021 @BrianChingono

How much do securities analysts overestimate long-term revenue and earnings growth?

Core argument: From 1997 to 2021, US securities analysts overestimated cumulative earnings before tax by 28.4% on 2-year forecasts and 36.8% on 3-year forecasts, errors larger than their revenue misses.

From 1997 to 2021, US securities analysts consistently overestimated 2-year cumulative revenue growth forecasts by 4.3% and 3-year forecasts by 4.6%. The errors were even more pronounced for Earnings Before Tax (EBT), with overestimations of 28.4% for 2-year and 36.8% for 3-year forecasts. Analysts' forecasts tend to overshoot actual outcomes, particularly in areas critical for stock prices, such as earnings further down the income statement and further out in time. While a naïve estimate based on long-term GDP growth (6.3% annually) proved more accurate, analysts' forecasts overshot by 20-40% on average. This persistent overestimation suggests a bias towards optimism, highlighting the challenges in accurately predicting long-term earnings growth.

Takeaways by Macro Roundup® AI

  1. From 1997 to 2021, US securities analysts overestimated cumulative earnings before tax by 28.4% on 2-year forecasts and 36.8% on 3-year forecasts, errors larger than their revenue misses.
  2. US analysts' cumulative revenue growth forecasts overshot actual outcomes by 4.3% over two years and 4.6% over three years, with errors larger further down the income statement and further out in time.
  3. A naïve estimate based on long-term GDP growth of 6.3% annually proved more accurate than analysts' forecasts, which overshot by 20–40% on average, suggesting a bias toward optimism.

From 1997 to 2021, US securities analysts systematically overestimated 2-year cumulative revenue growth forecasts by 4.3% and 3-year forecasts by 4.6%, but their forecast errors were even larger for EBT: 28.4% high for 2-year and 36.8% for 3-year forecasts

The Sages of Wall Street: Extended Excerpt Image 1

Using a database of all US stocks from 1997 to 2021, we measured the median analyst estimate for growth over the next two to three years across a range of earnings metrics. We then compared these forecasts against the actual median outcomes over the next two to three years. While the estimated and actual growth rates in the table below are annualized for simplicity, the error is shown on a cumulative basis to reflect the magnitude of the mistakes at the end of each horizon. Analysts’ forecast errors seem to be bigger precisely in the areas that should matter most for stock prices: earnings further down the income statement that go to equity investors, and earnings further out in time.

Brian Chingono and Greg Obenshain, "The Sages of Wall Street," Verdad, October 2022, https://mailchi.mp/verdadcap/the-sages-of-wall-street

The Sages of Wall Street

Last week, we showed that past earnings growth does not predict future earnings growth. When earnings growth is measured over long horizons, there is little to no evidence of persistence beyond chance, even among the high-fliers that have grown the fastest in the past.

But of course, investors don’t simply look in the rearview mirror when projecting future earnings growth. They also evaluate additional information, including interviews with management, studies of firms’ competitive landscapes, and forensic reviews of any clues that are hidden in the footnotes of firms’ financial statements.

But how good are security analysts at predicting growth? In the paper we referenced last week by Chan et al. (2001), the authors state that “it is commonly suggested that one group of informed participants, security analysts, may have some ability to predict growth.... Over long horizons, however, there is little forecastability in earnings, and analysts’ estimates tend to be overly optimistic.”

We tested this finding for ourselves and came to a similar conclusion, as shown in the table below. Using a database of all US stocks from 1997 to 2021, we measured the median analyst estimate for growth over the next two to three years across a range of earnings metrics. We then compared these forecasts against the actual median outcomes over the next two to three years. While the estimated and actual growth rates in the table below are annualized for simplicity, the error is shown on a cumulative basis to reflect the magnitude of the mistakes at the end of each horizon.

The Sages of Wall Street: Extended Excerpt Image 2


Across the board, these results seem to confirm Chan et al.’s conclusion about the optimism of analysts’ forecasts since the estimated growth rates systematically overshoot the actual outcomes. Importantly, analysts’ forecast errors seem to be bigger precisely in the areas that should matter most for stock prices: earnings further down the income statement that go to equity investors, and earnings further out in time.

While analyst estimates of future revenue are relatively close to actual outcomes, their accuracy deteriorates considerably as you move further down the income statement toward measures like Earnings Before Tax (EBT) that better reflect the earnings that are available to equity investors. And in each case, the cumulative error widens as you move further out in time from two years to three years in the future.

What if we replaced the analyst forecasts with a naïve estimate that corresponds with long-term GDP growth? Since 1947, US GDP growth has averaged 6.3% per year on a nominal basis (including inflation of around 3.5% per year). In the table below, we show the cumulative errors from forecasting 6.3% annualized growth for every company, compared to the cumulative errors from analyst forecasts.

The Sages of Wall Street: Extended Excerpt Image 3


It turns out that the naïve estimate of GDP growth is much more accurate, on average, with the median error being within a few percentage points of the actual outcome. On the other hand, analyst forecasts tend to overshoot the mark by 20-40% on average, when predicting earnings over a two- to three-year horizon.

This finding confirms Chan et al.’s observation that “it is difficult to see how the profitability of the business sector over the long term can grow much faster than overall gross domestic product.”

Fair enough, but fundamental investors might object that they don’t invest in average companies. What we want to understand is the distribution of forecasts versus actual results. Are analysts effective at separating high- and low-growth firms more broadly?

And here, we find some evidence of analyst forecasting skill. Below we show a table where we sorted analysts’ estimates of revenue and EBITDA growth into quintiles, and actual growth outcomes into quintiles. We then evaluate how accurate analysts are at selecting which growth quintile a company belongs to.

An accurate prediction would be a company where analysts expect top quintile growth, and actual growth over the next three years is indeed in the top quintile. These accurate predictions are tagged with a one in our data, and all other outcomes are tagged with a zero. The average of this binary column gives us the sorting accuracy of analyst forecasts. As shown in the table below, analysts are up to 50% accurate in the highest-expectation quintile, whereas they are around 30-40% accurate in other forecast quintiles, a significant improvement over random chance (20%).

The Sages of Wall Street: Extended Excerpt Image 4


Some readers objected last week to our quip that analysts might as well assume the same growth rates for SaaS software companies as coal miners. This table does suggest that when analysts forecast top-quintile growth, they’re accurate 50% of the time, and when they forecast bottom quintile growth, they’re accurate 30-40% of the time, which is far better than random chance and suggests that analysts are basing their forecasts on some good signals.

But there’s a wrinkle to this analysis.

If a stock is richly priced because analysts expect 20% annualized earnings growth over the next three years, investors in that firm generally won’t earn a significant return premium unless its realized earnings growth exceeds 20% per year. On the other hand, if realized growth comes in at 10% annualized, the price decline could be catastrophic, as investors have seen when the pandemic-era “stay-at-home” trades like video conferencing and home exercise reversed dramatically in 2022. So we really care about the errors relative to the forecasts.

In the table below, we show median three-year forecasts and outcomes within each quintile of analyst expectations. The results indicate that analysts are generally directionally correct (the highest-expectation stocks grow faster than the lowest-expectation stocks), but the errors are significantly bigger in the higher-expectation quintiles than the lower-expectation quintiles, and errors are also significantly bigger the further down we look on the income statement.

The Sages of Wall Street: Extended Excerpt Image 5


This analysis provides a tidy logic for value investing. Value investing works because stocks with low growth expectations priced in are less likely to disappoint dramatically. It’s one thing to miss the three-year EBITDA estimate by 8% in a cheap company that’s already priced for slower growth than inflation. It’s quite another scenario to miss the three-year EBITDA estimate by 68% in a company that’s priced to grow 5x faster than GDP. And, as you’ll recall from Figure 2, about two-thirds of the companies assigned by analysts to the lowest-expectation category end up delivering positive surprises over the next three years.

Perhaps these results simply reflect human bias toward overconfidence, and more accurate predictions could be made by algorithmically weighting metrics from the financial statements? After all, the superiority of mechanical (statistical) predictions over clinical forecasts has been well documented across a range of disciplines in numerous studies. In the next installment of our research series, we’ll explore whether better growth forecasts can be made using quantitative measures.

  • Business Cycle
  • Comparisons
    • Historical
  • GDP
    • Financial Markets
    • Growth

Have profits peaked at American businesses?

AI Summary. US corporate profits reached a record 12% of gross national product, boosted by low interest rates, low taxes, and stagnant wages, but all three advantages are reversing as borrowing costs rise, a 15% minimum corporate tax and 1% buyback tax take effect, and wages increase.

Economist Staff The Economist
Date Posted:
October 13, 2022
Is Database:
Database

US corporate profits reached an all-time high of 12% of GNP in Q2 2022, driven by low interest rates, taxes, and stagnant wages. However, these advantages are reversing, raising questions about profit margins.

Are the forces behind record corporate profits reversing?

Core argument: US corporate profits hit an all-time high of 12% of GNP in the second quarter of 2022, driven by rock-bottom interest rates, low taxes, and stagnant wages, advantages that are now reversing.

In Q2 2022, US corporate profits reached an all-time high of 12% of GNP, driven by rock-bottom interest rates, low taxes, and stagnant wages. However, these structural advantages are reversing. Rising interest rates will increase debt servicing costs, affecting even the 89% of S&P 500 companies with fixed-rate debt. Tax policies are tightening, with the Inflation Reduction Act introducing a 15% minimum corporate-tax rate and a 1% tax on share buy-backs. Labor costs are rising as the job market remains strong, with wages increasing and union activity reviving. UBS estimates that labor-intensive sectors like retail could see a 2% decline in operating profits for every 1% wage increase. As these factors converge, the sustainability of record-high profit margins is in question, especially if an economic slowdown or recession occurs, historically leading to a 13% drop in earnings per share during such periods.

Takeaways by Macro Roundup® AI

  1. US corporate profits hit an all-time high of 12% of GNP in the second quarter of 2022, driven by rock-bottom interest rates, low taxes, and stagnant wages, advantages that are now reversing.
  2. The Inflation Reduction Act introduces a 15% minimum corporate-tax rate and a 1% tax on share buy-backs, while rising interest rates lift debt-servicing costs even for the 89% of S&P 500 companies with fixed-rate debt.
  3. UBS estimates that labour-intensive sectors such as retail could see a 2% decline in operating profits for every 1% wage increase, and earnings per share have historically fallen 13% during recessions.

rock-bottom interest rates, low taxes, and stagnant wages helped drive US corporate profits to an all-time high of 12% of GNP in Q2 ’22, but that these structural may be reversing

“…Powerful structural forces have been propelling earnings to one record after another, relative to GDP, important engines of corporate profits—rock-bottom interest rates, low taxes and stagnant wages—may be going into reverse. Although floating-rate debt accounts for just 11% of S&P 500 companies’ total borrowing, a slug of the remaining 89% will also need to be refinanced sooner or later—almost certainly at much higher cost. That includes $1trn-plus of investment-grade bonds issued in 2020. According to UBS, a bank, labour-intensive sectors such as retail could see operating profits decline by 2% for every additional one-percentage rise in wages …”

Economist Staff, "Have profits peaked at American businesses?,"The Economist, October 9, 2022, https://www.economist.com/business/2022/10/09/have-profits-peaked-at-american-businesses

Have profits peaked at American businesses?

Fedex nearly failed to get its wheels off the ground. Months after it first began delivering packages overnight in 1973, the first oil shock buffeted the global economy and the young logistics firm looked destined to crumble. Now, as the Organisation of the Petroleum Exporting Countries once again sent shock waves through the already wobbly world economy with an announcement on October 5th of a sharp cut in output, fuel prices are just one of the firm’s worries. Weak package volumes and persistently high costs caused FedEx to withdraw next year’s profit guidance in September, knocking more than a fifth, or $11bn, off its market value.

FedEx has long been regarded as a bellwether for the broader economy. In a sign that this reputation is well-earned, corporate titans everywhere are now warning of profit hits as Wall Street gears up for America’s earnings season, which began this week. On October 6th Shell, a British oil supermajor, said it expected margins in its refining and chemicals businesses to plummet. The next day Samsung, a South Korean electronics giant, cautioned that its operating profits will decline for the first time in three years.

Many icons of America Inc are making similar noises. Ford has blamed its expected profit squeeze on, among other things, shortages of parts for its cars. Nike is struggling to clear its bursting inventory of unsold sportswear. Even America’s tech behemoths, which are freezing hiring as advertisers tighten digital-marketing budgets and inflation-weary consumers put off buying a new smartphone, are no longer looking invulnerable. The odd set of upbeat results, such as PepsiCo’s on October 12th, only highlight how unfizzy the broader picture looks.

All told, forecasts for third-quarter profits for the s&p 500 index of big American firms have so far been revised down by 6.8% since June. That is more than twice as big as the average revision in the past decade. Expectations for next year are bound to fall. Some of the pain is down to the strong greenback, which makes foreign revenues, accounting for almost a third of the s&p 500’s total, worth less in dollars. A bigger reason is the economic slowdown. If this turns into a recession, as seems likely, bottom lines will almost certainly suffer more, which they tend to whenever gdp contracts. Since the second world war earnings per share fell by an average of 13% around recessions, calculates Goldman Sachs, a bank.

Have profits peaked at American businesses?: Extended Excerpt Image 1


In the past few decades such cyclical dips have mostly been short-lived episodes in a long bull-run for corporate profits. Powerful structural forces have been propelling earnings to one record after another, relative to gdp (see chart 1). In the last quarter they were at an all-time high. Some of these long-lived profit motors are winding down. Globalisation, which allowed companies to cut costs and become more efficient, is stalling amid geopolitical tensions. Global trade will grow by only 1% next year, the World Trade Organisation forecast on October 5th. Two days later America tightened its restrictions on the export of technology to China even further. At the same time, relentless consolidation, which has made many industries more concentrated and lucrative, may have run its course: trustbusters are no longer as relaxed as they had been about oligopolies, which anyway have accrued so much market power that it is difficult to see it rising further.

More worrying for ceos, other important engines of corporate profits—rock-bottom interest rates, low taxes and stagnant wages—may be going into reverse. After years of receiving a small share of companies’ takings, lenders, governments and labour are demanding more.

Historically low rates of interest and tax have contributed one-third of the s&p 500’s profit growth (excluding financial firms) in the past two decades, according to a study by Michael Smolyansky of the Federal Reserve. Both are now rising. Higher interest rates will make it costlier for companies to service their debts, which will eat into the bottom line. To begin with, this will affect those companies—typically riskier ones—that borrowed at a floating rate. Although floating-rate debt accounts for just 11% of s&p 500 companies’ total borrowing, a slug of the remaining 89% will also need to be refinanced sooner or later—almost certainly at much higher cost. That includes $1trn-plus of investment-grade bonds issued in 2020.

Just as financiers become more demanding, so too is the taxman. As appetite for deficit-funded tax cuts wanes, another Tax Cuts and Jobs Act, which was signed into law by Donald Trump in 2017 and slashed the statutory corporate rate from 35% to 21%, looks unlikely. The Inflation Reduction Act (ira), passed recently under Mr Trump’s Democratic successor, Joe Biden, includes a 15% minimum corporate-tax rate on profits of businesses with more than $1bn in pre-tax income. In addition, earlier this year interest-expense deductions became less lenient. Goldman Sachs reckons that the new rules will reduce overall s&p 500 earnings by a modest 1% in 2023, with technology and health-care sectors hit hardest. Still, strained public finances make it likely that taxes will rise in the medium term. Adding insult to injury, the ira introduces a 1% tax on share buy-backs, indicating a political appetite to squeeze companies with nothing better to do with their profits than fork them over to shareholders.

Have profits peaked at American businesses?: Extended Excerpt Image 2


Employees, too, are tired of being squeezed. Since the 1970s the share of gdp going to workers has declined across the rich world, even as that going to companies in the form of profits has risen. This so-called labour share spiked during the pandemic, when many companies continued to pay workers even as gdp plummeted. It came down but earlier this year remained the highest it had been since the early 2000s. Labour accounts for 40% of costs at big American firms. The actual contribution of wages to costs is far higher: after all, suppliers have to pay their own workers, too, and pass some of those costs up the value chain. Official figures for September, released on October 7th, suggest that the red-hot job market is not cooling fast enough and wages are still going up. Since pay increases are sticky, they can remain a significant drag on margins. According to ubs, a bank, labour-intensive sectors such as retail could see operating profits decline by 2% for every additional one-percentage rise in wages (see chart 2).

American chief executives are less squeamish than their European counterparts about countering the combination of rising labour costs and weakening demand with lay-offs. Some are already trimming payrolls. On October 6th it was reported that General Electric was planning to sack 20% of staff at its American wind-turbine business. Intel, a chipmaker, is also rumoured to be cutting thousands of jobs.

Yet businesses may find it harder than in the past to wield the axe. The balance of power between labour and capital is shifting. A new rule proposed by the Department of Labour on October 11th would make it harder for firms to classify their workers as contractors rather than employees, raising costs. Union membership, which spent the second half of the 20th century in decline, is enjoying a small but significant revival. A Gallup poll puts public support for organised labour at its highest level since 1965.

Many businesses are already feeling the heat. A walkout of 90,000 railroad workers was narrowly averted in September after unions threatened to bring railways to a standstill, which could have done $2bn-worth of damage per day to the economy. Younger workers are discovering a taste for organising—even wage rises this summer have not stopped Starbucks baristas from joining union efforts in growing numbers. ceos may not be able to keep them, the lenders and the government out of the profit pool for much longer.

  • Financial Markets
  • GDP
    • Business Cycle
    • Growth

China and the West are in a race to foster innovation

AI Summary. The US spends about $800bn, or 3.8% of GDP, on research and development across corporate R&D, venture capital, and state funding, compared with China's $660bn, or 2.7% of GDP. The US approach is distributed and bottom-up, relying on private business, venture capital, and philanthropy, while China coordinates through state-owned enterprises and industrial subsidies.

Economist Staff The Economist
Date Posted:
October 13, 2022
Is Database:
Database

The US leads with an $800bn investment in corporate R&D, venture capital, and state funding, 3.8% of GDP, surpassing China’s $660bn 2.7% of GDP.

How do US and Chinese approaches to research funding differ?

Core argument: The US invests $800bn in corporate R&D, venture capital, and state funding, or 3.8% of GDP, versus China's $660bn, or 2.7% of GDP.

The US leads with an $800bn investment in corporate R&D, venture capital, and state funding, representing 3.8% of GDP, surpassing China's $660bn or 2.7% of GDP. This investment strategy underscores the West's commitment to maintaining a technological edge over China, which has rapidly increased its R&D spending to 85% of America's by 2020. Despite China's coordinated efforts through state-owned enterprises and industrial subsidies, the US benefits from a more distributed and bottom-up approach involving private businesses, venture capital, and philanthropic funders. The global competition for technological dominance is intensifying, with both regions focusing on strategic industries like AI, semiconductors, and biotech. However, China's system faces challenges in fostering future breakthroughs due to its top-down approach, while the US continues to leverage its open market and diverse talent pool to drive innovation.

Takeaways by Macro Roundup® AI

  1. The US invests $800bn in corporate R&D, venture capital, and state funding, or 3.8% of GDP, versus China's $660bn, or 2.7% of GDP.
  2. China raised its R&D spending to 85% of America's by 2020, pursuing coordinated support through state-owned enterprises and industrial subsidies, while both countries target AI, semiconductors, and biotech.
  3. The US innovation model is distributed and bottom-up, drawing on private businesses, venture capital, philanthropic funders, an open market, and a diverse talent pool, whereas China's top-down system faces challenges in fostering future breakthroughs.

American’s $800B investment in corporate R&D, venture-capital investment, and government funding/subsidies represents 3.8% of GDP, maintaining an edge over China’s $660B (2.7% of GDP)

“…The Economist has totted up corporate spending on R&D, venture-capital investment, direct government funding and, for advanced technologies, implicit funding through subsidies, and subtracted the overlap among these categories. This calculation confirms that America maintains a slight edge, spending about $800bn or 3.8% of GDP in 2020. That compares to about $660bn in China after adjusting for differences in the cost of living, or 2.7% of GDP….”

Economist Staff, "China and the West are in a race to foster innovation,"The Economist, October 13, 2022, https://www.economist.com/briefing/2022/10/13/china-and-the-west-are-in-a-race-to-foster-innovation

China and the West are in a race to foster innovation

China’s government is planning on winning the ai race, winning future wars and winning the future,” warned Todd Young, an American senator, in July. “At stake” in the West’s technological competition with China, echoed a report from American officials and businessmen in September, “is the future of free societies, open markets, democratic government, and a world order rooted in freedom not coercion.” This week the head of a British intelligence agency joined the chorus, urging “deep investments” in new technology to counter China’s growing prowess.

The anxiety is easy to understand. In 2008 China spent a third as much as America did on research and development (r&d) and about half as much as Europe, after adjusting for differences in the cost of living. By 2014 it had surpassed Europe. By 2020 its spending was 85% of America’s.

The fruits of this investment are becoming apparent: in August a Japanese research institute calculated that China now produces more of the world’s most highly cited academic research than America does. Since 2015 more patents have been issued in China than in America. China’s output of a basket of sophisticated goods including information technology, pharmaceuticals and electronics is expected to surpass America’s this year, according to a report published by the Information Technology and Innovation Foundation, an American think-tank. “China has become a serious competitor in the foundational technologies of the 21st century,” concluded another report last year from the Belfer Centre at Harvard University.

Small wonder, then, that Western countries are embarking on a frantic effort to retain or regain their technological edge. On October 7th America issued fierce new restrictions on exports to China of advanced semiconductors and related equipment. The new rules could be as crippling to the Chinese chip industry as previous American sanctions were to Huawei, a Chinese telecoms firm, says Greg Allen, who used to head the artificial-intelligence (ai) unit at America’s Department of Defence. “It’s a total clamp down, trying to cut off every head of the hydra of China’s chip industry.”

As well as trying to disrupt the flow of technology abroad, America’s government is investing more in innovation. In August Congress approved $370bn of spending on green energy, including lots of money for research. The month before it passed the Chips and Science Act, which provides $52bn over five years for the semiconductor industry, some of which will incentivise private r&d.

The act also revamps the National Science Foundation (nsf) to put more emphasis on applied science and technology and potentially doubles its funding. Germany, Japan and South Korea are making multi-billion-dollar investments in computer chips. Last year Britain announced the $1bn Advanced Research and Invention Agency (aria) to supercharge high-risk, high-reward science.

The result of all this is a global boom in investment in innovation. In 2020 the world’s spending on r&d exceeded $2.1trn, over 2.5% of global gdp, a record. The binge has three notable features. The first is the heavy involvement of governments, which are unwilling to leave investment to capital markets and are instead both funding r&d and subsidising production of certain high-tech goods. Both China and the West explicitly link such spending to geopolitical competition. “Technological innovation has become the main battlefield of the international strategic game,” said China’s president, Xi Jinping, in a speech last year to Chinese scientists. “We’re in a multi-generation era-defining competition against the ccp,” rhymes Mr Young, one of the sponsors of the Chips Act.

The second feature of the new era is experimentation with different types of funding that couple industrial policy with efforts to promote risk-taking or private-sector rigour. America and Britain, for instance, are reviving research missions akin to America’s cold-war quest to put a man on the Moon. China, meanwhile, is using “guidance funds”, in which the state takes a stake alongside private investors, to steer money to startups in ai and chips, among other advanced technologies.

Third, governments are trying to ensure their country captures more of the benefits of innovation. That can mean both preventing exports of some goods and using industrial policy to promote domestic production.

But there remain big differences in approach between China and the West—most notably the far more muscular role the state still plays in directing innovation in China to favoured industries. The West, in contrast, relies on a more diffuse network of universities, non-profits and private businesses that have more freedom to set their own priorities. There is little doubt that China’s system has helped it catch up with the West in some existing technologies, but analysts question whether it will be as good at generating future breakthroughs. The answer will determine the outcome of the global battle for technological dominion.

America’s government invested lavishly in innovation during the cold war, through such organisations as the nsf and the Defence Advanced Research Projects Agency (darpa). Its spending peaked at 1.86% of gdp in 1964. But after the fall of the Berlin Wall federal spending on r&d fell well below 1% of gdp. Private investment, meanwhile, doubled from 1% of gdp in 1979 to 2% in 2017. Giant tech firms such as Google, Facebook (now Meta), Amazon and Apple sprouted in America. China spawned similar titans, such as Alibaba, Baidu, JD.com and Tencent.

But on both sides of the Pacific the age of free-flowing private capital left many disappointed. The Communist Party has called the spread of big consumer-tech firms a “disorderly expansion of capital”. It has obliged China’s internet giants to follow its priorities, blocking share sales and issuing abrupt regulations to cow wayward firms. It seems to want less video-gaming and online commerce and more ai, chips and green tech.

Many Americans have similar misgivings. Peter Thiel, a fabled investor, has argued that there has been too much investment in “bits” (software and analytics) and not enough in “atoms” (hardware and manufacturing). “With chips we were caught behind the eight ball,” says Eddie Bernice Johnson, a Democrat from Texas who chairs the committee that drafted the Chips Act, “It was a national security imperative.” Mr Young of Indiana agrees: “The totally free-market theories of Friedman, Hayek—they don’t make sense when you’re facing an existential threat that plays with market forces.”

Buying breakthroughs

To allow a proper comparison of the sums devoted to innovation on the two sides of the Pacific, The Economist has totted up corporate spending on r&d, venture-capital investment, direct government funding and, for advanced technologies, implicit funding through subsidies, and subtracted the overlap among these categories. This calculation confirms that America maintains a slight edge (see chart 1), spending about $800bn or 3.8% of gdp in 2020. That compares to about $660bn in China after adjusting for differences in the cost of living, or 2.7% of gdp.

China and the West are in a race to foster innovation: Extended Excerpt Image 1


But China’s spending is growing far quicker than the West’s. China’s investments are also more co-ordinated. Although its government and America’s both directly dispense only about 15-20% of their country’s expenditure on innovation, state-owned enterprises and industrial subsidies massively increase the influence of the state in China (see chart 2). Different arms of government have also set up nearly 2,000 “guidance funds” in which the state invests alongside private capital. The Chinese government began investing in semiconductors in this way as early as 2014, with a $20bn “Big Fund”. The second iteration of the fund has raised nearly $30bn. The state is now China’s biggest investor in venture-capital and private equity, contributing over 30% of the total.

China and the West are in a race to foster innovation: Extended Excerpt Image 2


All this allows the government to steer money towards its goals, in what is called juguo tizhi or the “whole-of-the-nation system”. Whereas in America the share of vc devoted to strategic industries as defined by the Belfer Centre report (ai, semiconductors, biotech, energy and quantum computing) has gradually grown from 10% to 20% over the past decade, in China it soared from 15% in 2019 to 35% in 2020 in line with government directives (see chart 3).

China and the West are in a race to foster innovation: Extended Excerpt Image 3


Yutao Sun and Cong Cao, two Chinese academics, argued in Nature last year that juguo tizhi had helped develop “a few state-led sectors with clear goals, such as high-speed rail and large passenger aircraft”. It was less effective, however, in “areas where there is no leader to follow”. Only 6% of China’s r&d spending is on basic research, compared with 17% of America’s.

What is more, juguo tizhi can also lead to misallocation of funds. A paper published in the journal Econometrica in July suggests that Chinese spending on r&d spurs less growth in productivity than that of neighbouring Taiwan. That is in part because the state often supports soes, even if they are less productive. Several studies suggest that corporate r&d in China is about half as productive as in America (although they do not focus exclusively on advanced technology).

America’s expenditure, meanwhile, is much more diffuse. Private businesses account for about 60%, venture capital for nearly 20% and foundations, charities and universities more than 5%. In a recent presentation, Pierre Azoulay, a professor at mit, notes that the “Cambrian explosion of philanthropic funders” is a “silver lining” compared with the perceived sclerosis in government funding. From 2010 to 2019, research funding from non-profits nearly doubled, from $12bn to $22bn. “Our system is unique because its more distributed and bottom-up; not top-down,” says Maria Cantwell, another senator.

America may also be more daring in its investments. The Institute for Progress (ifp), an American think-tank, is helping government agencies distribute grants more effectively, says Caleb Watney, a co-founder. Erwin Gianchandani of the nsf cites “golden tickets” as an example. Rather than the standard consensus-based process to allocate funding, a single reviewer can champion a project.

Michael Lauer, head of extramural research at America’s National Institutes of Health (nih), lists a handful of new programs where labs receive funding with far fewer strings attached than normal. The Other Transactions Authorities, a recent nih program that quickly funds unconventional projects, disbursed over $2bn in 2020 and 2021.

Hunting for lightbulbs

America is also creating more “moonshot” programs in an effort to replicate the success of darpa. Last year it launched the $1bn Advanced Research Projects Agency for Health (arpa-h) to focus on ambitious biomedical research. The total amount of funding in this category increased from about $4bn in 2021 to nearly $6bn in 2022. Tom Kalil of Schmidt Futures, another organisation that aims to shape policy on innovation, says this heralds a shift towards more risk-taking. China lacks any equivalent funding agencies, notes Mr Cao of Nottingham University China.

It is possible to exaggerate the strengths of both the American and Chinese systems. For all the talk of moonshots, notes a former White House official, nih was still slow to fund research on covid-19 at the beginning of the pandemic. And researchers are still often buried in paperwork. The new funding does little to address the administrative burden in the current system—researchers lose about 40% of their time to that, notes Tony Mills of the American Enterprise Institute, another think-tank. By the same token, although thousands of new firms have sprung up in China in favoured industries, such as ai and semiconductors, most of them do not seem to have achieved much.

Neither system has a monopoly on results. According to a report published in September by the Special Competitive Studies Project, a research group organised by Eric Schmidt, a former ceo of Google (and a former member of the board of The Economist), China is dominant in some industries, such as 5g telecoms. It makes some 80% of the world’s lithium batteries. But the West is ahead on biotech, cloud computing and ai. It has been the source of most fundamental advances in these fields, such as crispr (a gene-editing technology) and the transformer architecture that underpins many big ai models.

Although few advanced computer chips are made in America, American firms tend to design them. asml, a Dutch manufacturer of chipmaking equipment, has a monopoly in the advanced lithography needed to make the fanciest ones. And the Chips Act is prompting Intel and tsmc, two of the biggest chipmaking firms, to build new semiconductor fabs in America. Intel is also set to spend nearly $20bn on new chip factories in Germany.

China has built first-rate ai models by throwing money at researchers and firms. Wu Dao, its version of gpt-3, an American ai model that can write like a human, uses ten times more parameters to train itself. Yet the chips used for much of this sort of machine-learning, gpus, were originally developed to generate graphics for video games—one of the industries on which the Chinese government has cracked down most ferociously. By the same token, it was not until September that a Chinese firm developed a vaccine against covid-19 that is as effective as Western ones—a recent high-stakes test of its capacity to innovate. “China does best in products where manufacturing is complex but the science is mature, for example in batteries,” says Dan Wang, an analyst at Gavekal Dragonomics, a research group.

But China is trying to mend some of the failings of its system. It boosted funding for basic research by 16% last year, in an attempt to foster more breakthrough discoveries. It is also trying to reduce centralisation. In July the party announced new rules to increase scientists’ autonomy. “There is evidence that China has recognised the limits of using a blunt metric to evaluate scientists,” adds Mr Wang. “Thus universities are starting to move towards the peer-review system of the West.”

There are some mistakes, however, from which China shows little sign of retreating. Mr Xi’s decision to rein in the tech industry contributed to an 11% contraction in venture-capital investment from the first three quarters of 2019 to the same period in 2022. In America vc investment grew by 70% in that time. China’s stubborn zero-covid policy, meanwhile, is driving foreign capital and talent out of the country. A survey by the German Chamber of Commerce in May found that nearly a third of foreign workers plan to leave.

Such talent is crucial to competitiveness. In the past China benefited from both foreign investment and large cohorts of “sea turtles”, students and researchers who work or study abroad and later return. The share of Chinese students studying abroad who eventually returned home rose from 25% in 2004 to 65% in 2019. And from 2015 to 2019, the number of academic papers published involving co-operation between American and Chinese researchers grew by over 10% a year, according to Nature.

Yet in 2020 this growth in academic collaboration between the two countries abruptly stalled. Less than half as many Chinese received visas to study abroad in the first half of 2022 as in the first half of 2019. This pulling apart is bad for the world, but China may suffer more. It does not have as diverse a pool of researchers as the West. According to data from MacroPolo, a think-tank, although 60% of the world’s best ai researchers work in America, over two-thirds of them are foreign (and over a quarter of them Chinese). In contrast, China draws overwhelmingly on domestic talent: almost all its best ai researchers are Chinese, and 70% of them have studied only in China.

America is not only open to foreign expertise, it also benefits from a big network of alliances with other technologically advanced countries. Collectively, America, Britain, France, Germany, Japan and South Korea spend over twice as much on r&d as China. China, by contrast, has few allies, and none that are powerhouses of research and innovation.

Bulbs blown

American politicians do not seem to understand the advantage conferred by their country’s openness, however. The original draft of the Chips bill included a provision to boost skilled immigration. Although some politicians, including Mr Young, gave it cautious support, it had to be removed to ensure the support of more Republicans, in particular. (America’s allies, happily, are doing better. Britain has devised a scheme to provide visas to graduates of top universities. Australia and Canada, already home to lots of immigrants, are increasing immigration further.)

Whatever the limits to America’s openness, however, China’s growing isolation—both self-imposed and enforced by restrictions like America’s new rules on tech exports—is far more severe. After several years when its technological rise seemed unstoppable, the outlook suddenly seems much less clear. In the coming days Mr Xi will preside over China’s 20th Party Congress. Across the Pacific, America’s Congress will be debating how much money to devote to the Research initiatives at agencies like the nsf. You can be sure each will be on the other’s mind.

  • Startups
  • Comparisons
    • Cross-country
  • Productivity
    • Innovation/Research
    • Investment

Bidens Marijuana Pardon Wont Release a Single Inmate

AI Summary. Blacks are 13% of the U.S. population but about one-third of those arrested for violent crimes, and 58% of state prisoners were sentenced for violent offenses versus 14% for drug offenses and 4% for drug possession. The author argues that releasing all drug offenders would leave the U.S. prison population the largest among advanced nations and racial disparities largely unchanged.

Jason Riley Wall Street Journal
Date Posted:
October 13, 2022
Is Database:
Database

@JasonRiley @WSJ, 13% of population blacks are 1/3 of those arrested for violent crime, driving racial disparity in incarceration rates, not drug offenses.

@JasonRiley @WSJ, 13% of population blacks are 1/3 of those arrested for violent crime, driving racial disparity in...

Would releasing all drug offenders reduce racial disparities in incarceration?

Core argument: As of 2019, 58% of U.S. state prisoners were sentenced for violent offenses, compared with 14% for drug offenses and 4% for drug possession.

The racial disparity in incarceration rates is primarily driven by violent crime statistics, with blacks comprising 13% of the U.S. population yet accounting for about one-third of those arrested for violent crimes. This imbalance persists despite efforts to address drug-related incarcerations, as drug offenders constitute a minor fraction of the prison population. As of 2019, 58% of state prisoners were sentenced for violent offenses, while only 14% were for drug offenses, and a mere 4% for drug possession. Even if all drug offenders were released, the U.S. would still lead in prison population among advanced nations, and racial disparities would remain largely unchanged. The focus on drug offenses overlooks the larger issue of violent crime's role in mass incarceration and racial imbalance, suggesting that policy shifts should address these core drivers to effect meaningful change.

Takeaways by Macro Roundup® AI

  1. As of 2019, 58% of U.S. state prisoners were sentenced for violent offenses, compared with 14% for drug offenses and 4% for drug possession.
  2. Blacks make up 13% of the U.S. population but about one-third of those arrested for violent crimes, a disparity the author identifies as the primary driver of racial differences in incarceration rates.
  3. Releasing all drug offenders would leave the U.S. leading advanced nations in prison population and racial disparities largely unchanged, according to the author, who argues policy should address violent crime.

Jason Riley, "Biden’s Marijuana Pardon Won’t Release a Single Inmate,"Wall Street Journal, October 11, 2022, https://www.wsj.com/articles/biden-marijuana-pardon-prison-midterms-crime-drug-offenders-racial-disparities-systemic-racism-war-on-drugs-pot-legalization-11665520780

Biden’s Marijuana Pardon Won’t Release a Single Inmate

Even Democrats who sympathize with President Biden’s decision to pardon thousands of people convicted of marijuana possession under federal law might question his timing.

Republican candidates across the country have made crime control a major issue in this year’s midterm elections, and Mr. Biden’s order could inadvertently help the GOP advance a narrative that Democrats are preoccupied with coddling criminals.

What trumps that concern for the White House, however, is that Democrats have their own narrative to push, which is that the war on drugs has led to the mass incarceration of people who are disproportionately black and is therefore racist. Following the White House announcement, an NAACP official told National Public Radio, “We’ve seen since the 1970s that marijuana policy was intentionally and malevolently constructed to target the African-American community.” President Obama made a similar claim in 2015. “Over the last few decades, we’ve also locked up more and more nonviolent drug offenders than ever before, for longer than ever before,” he said. “And that is the real reason our prison population is so high.”

What civil-rights activists often conveniently omit from this history is the role that black community leaders and the black press played a half-century ago in getting tougher drug laws passed. They also leave out the key role of black lawmakers in advancing legislation that created sentencing disparities for drug offenses. The fight in Congress in the 1980s and ’90s was led by black liberal Democrats, including Harlem’s Rep. Charles Rangel and Brooklyn’s Rep. Major Owens. A majority of the Congressional Black Caucus voted in favor of the law that created much harsher penalties for crack-cocaine offenses than for powder-cocaine offenses.

Whatever you think of the wisdom of this approach in hindsight, the claim that the initial war on drugs and subsequent escalations were motivated by racial animus toward blacks is nonsense.

There are strong libertarian arguments that the drug war, much like alcohol prohibition in the past, has on balance been a failure and that it’s time to cut our losses. Given that polls now show a majority of Americans, including about half of Republican voters, favor decriminalizing pot, the White House announcement might resonate with people in both parties. But if the goal is to address mass incarceration and racial imbalance in the prison system, then focusing on drug offenders is the wrong approach.

Even Mr. Biden had to concede that no one is in federal prison for simple marijuana possession. What he didn’t say is that even among those housed in state prisons—which hold about 90% of the country’s incarcerated population—a relatively small percentage is there on drug offenses, and almost all of those were convicted of trafficking, not for being caught with small amounts of drugs for personal use. “As a percentage of our nation’s incarcerated population, those possessing small amounts of marijuana barely register,” writes Yale law professor and former District of Columbia public defender James Forman in his book, “Locking Up Our Own.” “For every ten thousand people behind bars in America, only six are there because of marijuana possession.”

The reality is that what drives incarceration rates is violent crimes, not drug crimes. According to the Justice Department, as of 2019 some 58% of people imprisoned by states had been sentenced for violent offenses, 15% for property offenses, 14% for drug offenses and only 4% for drug possession. Put another way, drug offenders are less than a quarter of the violent offenders, and more than 85% of the prison population is there for something other than a drug offense. The U.S. regularly tops the list of advanced countries with the largest prison population, but if we sent home every incarcerated drug offender tomorrow, we’d still top the list.

Nor would releasing drug offenders do much of anything to address the racial imbalance among inmates, which results primarily from the fact that blacks are about 13% of the U.S. population yet around one-third of those arrested for violent crimes. So long as this racial gap in violent offenses persists, so will the racial gap in incarceration rates. “The racial disparities in prison populations would barely budge if all the people serving time for drug crimes were immediately released,” writes John Pfaff, a professor of criminal law at Fordham University, in his book, “Locked In.” And “it seems likely that scaling back the drug war would not on its own necessarily alter offending or enforcement patterns enough to bring about real change.”

Messrs. Forman and Pfaff are not indifferent to the problems of mass incarceration and racial inequality. What distinguishes both scholars is a desire to have an honest debate about what’s driving the phenomenon and, as important, what isn’t. Which is more than can be said about the Biden administration.

Ed Comment: Note ratio of black to non-black violent crime = (65%/13%)/(35%/87%)= 5/0.4 =12.5 times more violent crime before adjusting for statistically significant demographic differences.

“…Nor would releasing drug offenders do much of anything to address the racial imbalance among inmates, which results primarily from the fact that blacks are about 13% of the U.S. population yet around one-third of those arrested for violent crimes….”

  • Poverty/Crime
  • Workforce

Brad Sester On Current Accounts Surpluses And FX Reserves

AI Summary. Global current account surpluses are concentrated in China, Russia, and the Gulf, with China on track for at least $400bn, Russia $250bn, and the Gulf $400bn or more. Unlike before the global financial crisis, these surpluses are not showing up in official foreign exchange reserves, reducing demand for bonds and euros and making global fund flows harder to track.

Brad Setser @Brad_Setser
Date Posted:
October 13, 2022
Is Database:
Database

China, Russia, and the Gulf are driving the global current account surplus, with China on track for $400bn, Russia for $250bn, and the Gulf for $400bn or more.

Are large current account surpluses no longer showing up in official reserves?

Core argument: Setser finds the global current account surplus concentrated in China, Russia, and the Gulf, with China on track for at least $400bn, Russia $250bn, and the Gulf $400bn or more.

The global current account surplus is concentrated in China, Russia, and the Gulf, with China on track for at least $400bn, Russia for $250bn, and the Gulf for $400bn or more. Unlike before the global financial crisis, these surpluses are not reflected in FX reserves due to factors like rate differentials and exporters hoarding dollars in China, sanctions in Russia, and Saudi Arabia's shift from SAMA to a sovereign fund. This shift impacts financial flows, reducing demand for bonds and euros, and complicates tracking global fund flows. The reported fall in global reserves is largely due to valuation changes and real selling by EM Asian countries other than China. Despite high surpluses, these countries are neither selling nor adding to reserves, contributing to the decline in reported global reserves. Russia's current account surplus in early 2022 nearly matches China's, driven by high oil prices and low imports.

Takeaways by Macro Roundup® AI

  1. Setser finds the global current account surplus concentrated in China, Russia, and the Gulf, with China on track for at least $400bn, Russia $250bn, and the Gulf $400bn or more.
  2. Unlike before the global financial crisis, these surpluses are not showing up in FX reserves, owing to rate differentials and Chinese exporters hoarding dollars, sanctions on Russia, and Saudi Arabia's shift from SAMA to a sovereign fund.
  3. The reported fall in global reserves stems largely from valuation changes and real selling by EM Asian countries other than China, with high-surplus countries neither selling nor adding to reserves.

Brad Setser, “Brad Sester On Current Accounts Surpluses And FX Reserves,”@Brad_Setser, October 10, 2022, https://twitter.com/Brad_Setser/status/1579659816372666368

“As @BobEUnlimited notes, one big global shift has come from the change in the U.S. petrol balance. I think there has been another: a shift from a world where big current account surpluses show up in fx reserves to one where they don’t. Prior to the global financial crisis — and in the few years after it – reserve growth in China, Saudi Arabia and Russia more or less tracked to their combined current account surplus. That isn’t the case now…”

“… This matters because the global current account surplus today is almost entirely in China (on track for at least $400b), Russia (on track for $250b or so), and the Gulf (on track for $400b or more), and none are showing in any reserve growth. The reasons differ (rate differentials and exporters hoarding dollars for China, sanctions for Russia, the Saudi shift away from SAMA toward a sovereign fund) but the net effect is the same — none are likely to add to their formal reserves in 2022. This matters for financial flows (less demand for bonds, probably less demand for euros too — for strange reasons), but it also simply makes the global flow of funds hard to track. It also has led to a broad misunderstanding about what is driving the big reported fall in global reserves. That fall is mostly from valuation changes – combined with real selling by EM Asian countries other than China. The big surplus countries (China, Russia and Saudi Arabia, which is representative of the Gulf) aren’t selling (unlike in 15), but they also aren’t adding. Their missing accumulation thus is helping to drive the large reported fall in global reserves. Last thought: Russia’s reported current account surplus in the first part of 2022 is almost equal to that of China. That reflects high oil and low Russian oil imports. But it also reflects the big gap between China’s customs surplus and its BoP surplus…”

“…Bottom line: there hasn’t been this kind of surge in the aggregate surplus of the big authoritarian global powers that hasn’t been primarily intermediated through their relatively conservative central banks in recent financial history.”

  • Business Cycle
  • Comparisons
    • Cross-country
    • Historical
  • GDP
    • Financial Markets
    • Growth
    • Savings Glut/Trade Deficit

Return on Invested Capital

AI Summary. Analysis of Russell 3000 companies finds that return on invested capital tends to regress toward the mean: firms starting with the highest returns saw them decline on average over five years, while those starting with the lowest returns saw them rise. Individual results varied within each group.

Michael Mauboussin and Dan Callahan Morgan Stanley
Date Posted:
October 13, 2022
Is Database:
Database

Return on Invested Capital (ROIC) for both high-return and low-return firms tends to regress towards the mean, according to 2016-21 Russel 3000 data.

Does return on invested capital regress toward the mean over time?

Core argument: Russell 3000 data for 2016–21 show Return on Invested Capital regressing toward the mean, with high-return firms' average ROIC falling and low-return firms' average ROIC rising over the five-year period.

Analysis of Russel 3000 data from 2016-21 reveals that Return on Invested Capital (ROIC) for both high-return and low-return firms tends to regress towards the mean. High-return businesses saw their ROICs decrease on average, while low-return businesses experienced an increase, illustrating the concept of regression toward the mean, where extreme outcomes are followed by more average results. The data, segmented into quintiles based on 2016 ROICs, tracked each cohort over five years, highlighting this trend. Despite this general pattern, some high-ROIC firms improved further, and some low-ROIC firms did not see gains, indicating variability within the broader trend. This regression effect underscores the dynamic nature of business performance and the influence of market forces on financial metrics.

Takeaways by Macro Roundup® AI

  1. Russell 3000 data for 2016–21 show Return on Invested Capital regressing toward the mean, with high-return firms' average ROIC falling and low-return firms' average ROIC rising over the five-year period.
  2. The analysis sorted Russell 3000 companies into quintiles by their 2016 ROIC and tracked each cohort for five years, finding extreme initial outcomes followed by more average results.
  3. Variability persisted within the regression pattern, as some high-ROIC firms improved further while some low-ROIC firms recorded no gains.

Russel 3000 data from 2016-21 shows that ROICs for the high-return businesses go down on average and the ROICs for the low-return businesses go up on average as results regress towards the mean

“…Historical results show that ROIC tends to regress toward the mean. Regression toward the mean says that outcomes that are far from average are followed by outcomes with expected values closer to the average. Exhibit 5 breaks the population of companies into quintiles based on their ROICs in 2016 and follows each cohort for five years. It shows that the ROICs for the high-return businesses go down on average and the ROICs for the low-return businesses go up on average. This simple picture belies a lot of richness in the data. Some businesses start with high ROICs and get even better. Others have low ROICs that don’t improve. But regression is powerful…”

Michael Mauboussin and Dan Callahan, "Return on Invested Capital,"Morgan Stanley, October 6, 2022, https://www.morganstanley.com/im/publication/insights/articles/article_returnoninvestedcapital.pdf

  • Productivity
    • Institutional Capabilities
  • GDP
    • Financial Markets
    • Growth

East Asia Outpaces Other Regions in International Patenting

AI Summary. East Asia — including Japan, South Korea, China and Taiwan — has surpassed North America in international patent filings, with Japan accounting for 61% of the region's foreign patent applications, South Korea 18%, China 12% and Taiwan 7%. East Asia also received 41% of North American patents filed abroad.

Maria Santacreu Federal Reserve Bank of St. Louis
Date Posted:
October 13, 2022
Is Database:
Database

East Asia surpassed North America in filing international patents by 2003, with Japan leading the region with 61% of foreign patent applications from 2010 to 2019.

Has East Asia overtaken North America in international patent filings?

Core argument: East Asia surpassed North America in international patent filings by 2003, with Japan accounting for 61% of the region's foreign patent applications during 2010–2019, followed by South Korea at 18%, China at 12%, and Taiwan at 7%.

By 2003, East Asia (mainland China, Hong Kong, Japan, Macao, Mongolia, South Korea, and Taiwan) had surpassed North America in filing international patents, marking a significant shift in global innovation dynamics. From 2010 to 2019, Japan led the region with 61% of foreign patent applications, followed by South Korea (18%), China (12%), and Taiwan (7%). East Asia has emerged as a key destination for patent protection, with 41% of North American patents filed abroad going to the region during the 2010s. This trend reflects East Asia's rise as an innovation hub and a strategic location for protecting intellectual property amid growing high-tech competition. The region's increasing importance in technology-intensive goods imports and foreign direct investment has driven this shift, as inventors seek to safeguard their technologies from misappropriation. Consequently, East Asia's prominence in international patenting underscores its pivotal role in the global innovation landscape.

Takeaways by Macro Roundup® AI

  1. East Asia surpassed North America in international patent filings by 2003, with Japan accounting for 61% of the region's foreign patent applications during 2010–2019, followed by South Korea at 18%, China at 12%, and Taiwan at 7%.
  2. East Asia received 41% of North American patents filed abroad during the 2010s, making the region a key destination for patent protection.
  3. East Asia's growing importance in technology-intensive goods imports and foreign direct investment has driven the shift toward patent filing in the region, as inventors seek to safeguard their technologies from misappropriation.

Inventors in East Asia now file significantly more international patents than their North American counterparts to protect their intellectual property around the world

“…The figure above shows the evolution in the number of foreign patent applications filed by different regions of the world in foreign jurisdictions. By 2003, East Asia (mainland China, Hong Kong, Japan, Macao, Mongolia, South Korea and Taiwan) had surpassed North America.According to this measure of foreign patents, Japan, accounting for 61% of the region’s foreign patent applications from 2010 to 2019. South Korea, China and Taiwan followed, filing 18%, 12% and 7%, respectively. East Asia has risen as the main destination where inventors around the world seek patent protection. Of all the patents filed abroad by applicants in North America during the 2010s, 41% went to East Asia, while just 13% stayed in the region, and 11% went to Western Europe…”

Ana Maria Santacreu and Jesse LaBelle, "East Asia Outpaces Other Regions in International Patenting," Federal Reserve Bank Of St. Louis, October 3, 2022, https://www.stlouisfed.org/on-the-economy/2022/oct/east-asia-outpaces-other-regions-international-patenting

East Asia Outpaces Other Regions in International Patenting

The global need for patent protection has increased substantially over the last couple of decades. Because patents are territorial (they offer protection only in the jurisdiction where they are granted), innovators typically seek patent protection in multiple countries where they are interested in doing business to prevent the theft of ideas or to keep technological competition at bay. That was the case of the United States in Asia during the decades following the formation of the World Trade Organization, as we documented in a December 2021 essay in Economic Synopses.

In this blog post, we document changes in the patterns of patenting across regions around the world. We use data on patent applications filed by 213 jurisdictions, grouped into 14 regions.

The figure below shows the evolution in the number of foreign patent applications filed by different regions of the world in foreign jurisdictions. By 2003, East Asia (mainland China, Hong Kong, Japan, Macao, Mongolia, South Korea and Taiwan) had surpassed North America (Canada, Greenland and the United States) in terms of filing patents in other jurisdictions.

East Asia Outpaces Other Regions in International Patenting: Extended Excerpt Image 1


While the rate of patent applications filed abroad from North America slowed in the past few years, it continued to rise substantially in East Asia, widening the gap and positioning East Asia as one of the main innovation hubs seeking protection abroad. North America and East Asia were followed by Western Europe (Austria, Belgium, France, Germany, Liechtenstein, Luxembourg, Monaco, the Netherlands and Switzerland). Meanwhile, the growth rate in patent applications from northern Europe1 and from the rest of the world have been stable in recent years.

East Asia Rises as a Patent Application Destination

Exploring patenting activity in East Asia further, we found that the main innovator, according to this measure of foreign patents, was Japan, accounting for 61% of the region’s foreign patent applications from 2010 to 2019. South Korea, China and Taiwan followed, filing 18%, 12% and 7%, respectively, of patent applications abroad.

East Asia has risen not only as an innovation hub (i.e., filing patents abroad) but also as the main destination where inventors around the world seek patent protection.

Of all the patents filed abroad by applicants in North America during the 2010s, 41% went to East Asia, while just 13% stayed in the region, and 11% went to Western Europe. Those in Western Europe showed a slight preference for East Asia, with 37% of their patents filed abroad going to the region, compared with 34% filed in North America.

Even East Asian countries have a preference for their own region. Of all the patent applications filed by East Asian countries to other jurisdictions, 43% went to North America, while 36% stayed within the region, and 11% went to Western Europe.

These patterns of international patenting indicate a bias for seeking patent protection in East Asia, not only by countries outside the region but also by intraregional countries. The shift toward Asia has not always been the case. Instead, in the 1980s and early 1990s, the other most innovative regions were filing for patents with one another, while Asia was behind in both the origin and the destination of patent applications.

High-Tech Competition Builds in East Asia

What explains these new trends? There could be several reasons why East Asia has become the main destination where countries around the world seek patent protection.

First, Asia is an important destination of technology-intensive goods imports and foreign direct investment from North America and Western Europe. Hence, inventors in these developed regions may want to protect their exported technologies from theft and misappropriation by competitors in Asian countries.

Second, Asian economies are becoming innovation powerhouses, increasing competition for high-tech goods within the region. For instance, the Japanese and South Korean technology sectors have grown substantially, whereas China and Taiwan have been dominating the manufacturing of semiconductors. This regionally strong growth may have led to a “race to patent,” as each country attempts to become the dominant innovative force in that region and ward off competition.

In summary, foreign patenting has been increasing substantially in recent decades. While the U.S. and Western Europe have historically been seen as innovation powerhouses, East Asia has quickly established itself as both the main origin of innovations and the main destination for patent protection.

Note

This region comprises the Aland Islands, the Channel Islands, Denmark, Estonia, the Faroe Islands, Finland, Iceland, Ireland, the Isle of Man, Latvia, Lithuania, Norway, the Svalbard and Jan Mayen islands, Sweden and the U.K.

  • Productivity
    • Innovation/Research
  • Comparisons
    • Cross-country
    • Historical

China's demographic crisis looms over Xi Jinpings third term

AI Summary. China's population is projected to fall below 800m over the next 80 years, with annual births down more than 45% to 10.6m over roughly a decade despite policies encouraging higher birth rates. A shrinking, rapidly aging workforce may push wages up while eroding China's manufacturing cost advantage and straining healthcare and pension systems.

Eleanor Olcott Financial Times
Date Posted:
October 13, 2022
Is Database:
Database

China’s population is projected to fall below 800m over the next 80 years, posing significant economic challenges.

How will a shrinking, aging population reshape China's economy?

Core argument: China's annual births fell by more than 45% between 2012 and 2021 to 10.6m, despite policy shifts intended to encourage higher birth rates.

China's population is projected to fall below 800m over the next 80 years, posing significant economic challenges. The rapid aging of the population, exacerbated by the legacy of the one-child policy, will increase demands on healthcare and pension systems. Between 2012 and 2021, annual births dropped by over 45% to 10.6m, despite policy shifts to encourage higher birth rates. The shrinking workforce may drive wage increases, but it also risks eroding China's manufacturing cost advantage without a transition to a consumption-led economy. Local governments face fiscal pressures from rising healthcare costs and reduced property tax revenues. Efforts to boost fertility have been undermined by economic uncertainties and the zero-Covid policy, which has discouraged marriage and childbearing. High costs of raising children, nearly seven times per capita GDP, further deter families from having more children, threatening long-term economic stability and growth.

Takeaways by Macro Roundup® AI

  1. China's annual births fell by more than 45% between 2012 and 2021 to 10.6m, despite policy shifts intended to encourage higher birth rates.
  2. China's population is projected to fall below 800m over the next 80 years, with rapid aging compounded by the one-child policy legacy raising demands on healthcare and pension systems.
  3. The cost of raising a child in China is nearly seven times per capita GDP, which, alongside economic uncertainty and a zero-Covid policy that has discouraged marriage and childbearing, has undermined efforts to lift fertility.

“…Over the next five years, the first cohort of people who became parents during the “one-child policy” era that began in 1980 will increasingly advance from their 60s and 70s — or what sociologists describe as being “young-old” — into their 80s. Wang Feng, an expert on Chinese demographic change at the University of California, Irvine said this growing group of “old-old”, with a higher likelihood of developing costly chronic diseases, would make greater care demands both on their children and the state. “If this continues, how can China sustain the pension payments for this enlarging elderly population,” said Wang…”

Eleanor Olcott, "China’s demographic crisis looms over Xi Jinping’s third term,"Financial Times, October 2, 2022, https://www.ft.com/content/199c92ca-4f1e-4898-9152-d021936f6ab4

China’s demographic crisis looms over Xi Jinping’s third term

China’s president Xi Jinping is poised to secure an unprecedented third term as leader at a congress of his Communist party this month, but behind the political theatre a broader shift is playing out.

Demographers predict the world’s most populous country will start to shrink in 2022, a turning point with profound ramifications for its future.

“That China’s population decline has coincided with the start of Xi’s third term is symbolically and practically significant,” said Wang Feng, an expert on Chinese demographic change at the University of California, Irvine.

While Xi is clearly in the political ascendancy, the economic tools at his disposal are increasingly constrained by a property sector meltdown, the damage to consumer confidence caused by successive coronavirus lockdowns, and local government fiscal shortfalls.

The rapid ageing of China’s population — a process that will accelerate during Xi’s third term — will further chip away at Beijing’s powers to stimulate growth and manage economic crises.

China's demographic crisis looms over Xi Jinpings third term: Extended Excerpt Image 1


Over the next five years, the first cohort of people who became parents during the “one-child policy” era that began in 1980 will increasingly advance from their 60s and 70s — or what sociologists describe as being “young-old” — into their 80s.

Wang said this growing group of “old-old”, with a higher likelihood of developing costly chronic diseases, would make greater care demands both on their children and the state.

Local governments are already struggling to meet the rising cost of health and social care. Their spending on China’s sprawling zero-Covid infrastructure has ballooned, while tax receipts from the battered property sector have plummeted.

“If this continues, how can China sustain the pension payments for this enlarging elderly population,” said Wang.

Not all experts are pessimistic about the economic impact of the ageing population.

China's demographic crisis looms over Xi Jinpings third term: Extended Excerpt Image 2


Jane Golley, a China economist at the Australian National University, said a shrinking number of working-age people was a natural consequence of the country’s economic development.

“A smaller workforce means reduced labour supply, which means workers can demand higher wages,” Golley said. Growth in gross domestic product per capita would outpace overall GDP expansion as China’s population shrank, she said.

But other experts warned that China could lose its cost advantage in manufacturing without having transitioned to the consumption-led economic model of developed economies.

China’s birth rate has been in decline for many years. Between the start of Xi’s rule in 2012 and 2021, the number of babies born each year fell by more than 45 per cent, to 10.6mn.

China's demographic crisis looms over Xi Jinpings third term: Extended Excerpt Image 3


Beijing in 2016 eased national birth controls, which were widely known as the one-child policy in reference to the standard limit for urban residents of the dominant Han ethnic group. Local governments have since extended maternity leave and introduced subsidies for new parents.

China, which has the highest abortion rate among large economies, last year moved to tighten controls over abortions for non-medical purposes. Experts warned that officials could take more drastic measures to limit women’s access to abortion.

But Beijing’s measures to stimulate fertility have had little impact, particularly in the wake of the coronavirus pandemic and a strict zero-Covid policy that has disincentivised the young from getting married and having babies.

Yi Fuxian, an obstetrics expert at the University of Wisconsin-Madison and a long-term critic of the one-child policy, said rising unemployment and fear of persistent lockdowns have prompted young couples to delay marriage and childbearing. He estimated this would reduce the number of births in China by 1mn in both 2021 and 2022.

“The zero-Covid policy has greatly reduced people’s willingness to have children,” Yi said.

For a country’s population to remain stable, 2.1 children on average need to be born to each couple. Ms Li, a 34-year-old mother in the north-eastern province of Jilin, is one of the tens of millions of Chinese parents who have decided to stop at one.

Li, who declined to give her personal name, has a three-year-old and recently returned to part-time work selling tickets for local tourist attractions. “The expense of raising a child is like a bottomless pit,” said Li.

High property prices and heavy spending on education are major factors. In China, the average total cost of raising a child is nearly seven times per capita GDP, compared with four times in the US, according to YuWa Population Research, a Chinese think-tank.

Concerns about expensive childcare have been exacerbated by the economic insecurity wrought by lockdowns. Li’s hairdresser husband suffered a salary cut when his salon was forced to shut down during Jilin’s prolonged spring lockdown.

“One child is enough. We have no money or energy to raise a second,” she said.

  • Demographics
  • Workforce

Asset Returns and Labor Force Participation During COVID-19

AI Summary. Rising asset values during the pandemic are estimated to have pushed about 0.7m people aged 51-65 out of the U.S. labor force, accounting for 15% of the overall 1.8-percentage-point decline in labor force participation, which represented a net decrease of 4.7m workers. Whether falling asset prices would reverse this effect remains uncertain.

Miguel Faria-e-Castro Federal Reserve Bank of St. Louis
Date Posted:
October 13, 2022
Is Database:
Database

Pandemic wealth effect drives early retirement surge: 0.7m workers aged 51-65 exit workforce (15% of total LFP decline). Asset value gains since Jan 2020 accelerate labor force withdrawals.

Did rising asset values push older workers out of the labor force?

Core argument: Rising asset values during the pandemic are estimated to have pushed 0.7m people aged 51–65 out of the U.S. labor force by September 2021, accounting for 15% of the overall labor force participation decline since January 2020.

Rising asset values during the pandemic led to a significant reduction in labor force participation (LFP) among 51-65 year olds, with an estimated 0.7m people exiting the workforce by September 2021, accounting for 15% of the overall LFP decline since January 2020. The LFP rate fell from 63.4% to 61.6%, a 1.8-percentage-point drop, equating to a net decrease of 4.7m workers in the U.S. economy. This age group, more likely to retire, saw a 0.92 percentage point drop in LFP due to increased wealth from high returns on assets like stocks and housing. The impact of rising asset values may have compounded other factors such as health risks and caregiving responsibilities, influencing retirement decisions. It remains uncertain if declines in asset prices will reverse this trend or if labor supply effects are symmetric, prompting further research into these dynamics.

Takeaways by Macro Roundup® AI

  1. Rising asset values during the pandemic are estimated to have pushed 0.7m people aged 51–65 out of the U.S. labor force by September 2021, accounting for 15% of the overall labor force participation decline since January 2020.
  2. The U.S. labor force participation rate fell from 63.4% to 61.6%, a 1.8-percentage-point drop equal to a net decrease of 4.7m workers.
  3. Increased wealth from high returns on assets such as stocks and housing is estimated to have lowered labor force participation among 51–65 year olds by 0.92 percentage points, potentially compounding factors such as health risks and caregiving responsibilities.

Rising assets values reduced labor force participation for 51-65 year olds by 0.7mm people as of Sept. ‘21, 15% of overall LFP reduction since Jan. ‘20. It’s unclear whether recent declines in asset prices will reverse this trend. “…As of September 2021, the labor force participation rate was 61.6%, down from a pre-pandemic peak of 63.4% in January 2020. I try to quantify how much of the 1.8-percentage-point drop in LFP during 2020 and 2021 may have been related to rising asset values during that same period. I focus on households with members between 51 and 65 years of age who are thus more likely to retire. The computed change in the value of wealth leads to an estimated drop in LFP of 0.92 percentage points for this age group, which corresponds to 0.7 million people—about 15% of the total drop.Nor is it clear whether these labor supply effects are symmetric: Would people increase their LFP by the same amount if their wealth fell…”

Miguel Faria e Castro, "Asset Returns and Labor Force Participation During COVID-19,"Federal Reserve Bank of St. Louis, January 6, 2022, https://research.stlouisfed.org/publications/economic-synopses/2022/01/06/asset-returns-and-labor-force-participation-during-covid-19

Asset Returns and Labor Force Participation During COVID-19

As of September 2021, the labor force participation (LFP) rate1 was 61.6%, down from a pre-pandemic peak of 63.4% in January 2020. This 1.8-percentage-­point decline in the LFP rate corresponds roughly to a net decrease of 4.7 million workers in the U.S. economy, compared with the pre-pandemic period.2

In a previous essay, I discussed the large increase in excess retirements during the pandemic period relative to previous trends.3 An increase in retirements or a decrease in the number of retired people returning to work are among the reasons the LFP may have decreased and remained low. In that essay, I explained that there are many reasons older people may have chosen to accelerate their retirement plans, including greater risk of death conditional on infection and the need to care for family members. Another factor that may have enabled these retirements was rising asset values during the pandemic period. The figure shows that some of the most common asset classes, such as stocks or housing, posted historically high cumulative real returns during 2020 and 2021.4 Thus, these years were associated with significant increases in wealth for households exposed to these assets.

Asset Returns and Labor Force Participation During COVID-19: Extended Excerpt Image 1


In this essay, I try to quantify how much of the 1.8-percentage-point drop in LFP during 2020 and 2021 may have been related to rising asset values during that same period. To do this, I proceed in three parts. First, I take data on household portfolio composition from the 2019 Survey of Consumer Finances. This gives me a detailed picture of what household balance sheets looked like on the eve of the COVID-19 outbreak for a representative sample of the U.S. population.

Second, I impute the realized returns on several asset classes during the 2020-2021 period, which allows me to estimate the evolution in the value of net worth for households in the sample (assuming the composition of their portfolio remained fixed).

In the final step, I use standard estimates for the elasticity of LFP rates to changes in wealth; that is, I estimate how much the LFP rate is predicted to change for each household in the sample, given the estimated change in net worth. Standard theories of household behavior predict that people tend to work less in response to increases in wealth, and many studies have tried to empirically measure the magnitude of these effects. I combine the results of one such study5 with my estimates for the evolution of net worth to obtain estimates for the change in LFP of individual households, which can then be aggregated into an estimated change of the LFP rate.

I focus on households with members between 51 and 65 years of age who are thus more likely to retire. The computed change in the value of wealth leads to an estimated drop in LFP of 0.92 percentage points for this age group, which corresponds to 0.7 million people—about 15% of the total drop.

It is important to emphasize that rising asset valuations may not have necessarily caused people to exit the labor force (or remain out of it). These resulting increases in wealth may have, however, compounded other reasons to stop working, as mentioned in the second paragraph of this essay (i.e., risk of death from infection and increased domestic responsibilities).6 Finally, it is not clear whether these reductions in LFP are permanent, as people could eventually return from retirement, which is particularly likely for younger households. Nor is it clear whether these labor supply effects are symmetric: Would people increase their LFP by the same amount if their wealth fell? These questions are left for further research.

Notes

1 The labor force participation rate is the percentage of the civilian noninstitutional population 16 years and older that is working or actively looking for work.

2 This calculation uses as a reference point the civilian noninstitutional population as of September 2021, which was equal to 261.8 million people.

3 Faria-e-Castro, M. "The COVID Retirement Boom." Federal Reserve Bank of St. Louis Economic Synopses, No. 25, 2021;https://doi.org/10.20955/es.2021.25.

4 For reference, the cumulative real returns on stocks and housing for a period of the same length ending in December 2019 were 14.8% and 2.4%, respectively.

5 Benson, D. and French, E. "How Do Sudden Large Losses in Wealth Affect Labor Force Participation?" Federal Reserve Bank of Chicago Letter No. 282, January 2011;https://www.chicagofed.org/publications/chicago-fed-letter/2011/january-282.

6 See, for example, the following NPR story: "These Older Workers Hadn't Planned To Retire So Soon. The Pandemic Sped Things Up";https://www.npr.org/2021/08/23/1028993124/these-older-workers-hadnt-planned-to-retire-so-soon-the-pandemic-sped-things-up.

  • Business Cycle
  • Comparisons
    • Historical
  • GDP
    • Financial Markets
    • Growth
  • Workforce
    • Unemployment/Participation

Peter Thiel says California suffers from a tech curse. Is he right?

AI Summary. California's economy grew 18% over five years, the fourth-fastest in the US and ahead of Texas and Florida, with above-average growth even excluding technology, and median household income now 15% above the national median versus 7% a decade earlier. This evidence counters the argument that technology has left the state economically worse off.

Economist Staff The Economist
Date Posted:
October 13, 2022
Is Database:
Database

California’s GDP grew by 18% over the past 5 years, surpassing Texas & Florida. Excluding tech, California’s growth remained above average, driven by sectors like chemicals manufacturing.

Has technology left California's economy worse off?

Core argument: California's GDP grew 18% over the past five years, the fourth fastest in the US and ahead of Texas and Florida, with growth above average even excluding tech, driven by sectors such as chemicals manufacturing.

California's GDP grew by 18% over the past 5 years, ranking 4th fastest in the US, surpassing Texas and Florida. Even excluding tech, California's growth remained above average, driven by sectors like chemicals manufacturing. The median Californian household income is now 15% higher than the national median, up from 7% a decade ago. Unemployment and poverty rates have declined relative to national averages, with no significant evidence of poor residents leaving the state. While Peter Thiel argues that California suffers from a "tech curse," data suggests that tech has contributed to economic prosperity rather than detriment. Despite criticisms of political and housing issues, these challenges predate the tech boom and are not solely attributable to it.

Takeaways by Macro Roundup® AI

  1. California's GDP grew 18% over the past five years, the fourth fastest in the US and ahead of Texas and Florida, with growth above average even excluding tech, driven by sectors such as chemicals manufacturing.
  2. Median Californian household income stands 15% above the national median, up from 7% a decade earlier, while the state's unemployment and poverty rates have declined relative to national averages with no significant evidence of poor residents leaving.
  3. Against Peter Thiel's argument that California suffers from a "tech curse," the data suggest tech has contributed to the state's prosperity, and its political and housing problems predate the tech boom.

Over the past 5 years California's state-level GDP has grown by 18%, the 4thfastest rate in the country and outpacing Texas and Florida. Even subtracting tech California’s growth was above average. “…Peter Thiel suggested that California suffers from a “tech curse”: a play on the “resource curse”, the notion that countries with abundant natural resources often have weak economies and corrupt political systems. In the past five years, California’s state-level gdp has grown by 18%, the fourth-fastest rate in the country and a better performance than either Florida or Texas. Even subtracting tech, California’s growth was above average, according to our calculations…”

Economist Staff, "Peter Thiel says California suffers from a “tech curse”. Is he right?,"The Economist, September 2022, https://www.economist.com/finance-and-economics/2022/09/22/peter-thiel-says-california-suffers-from-a-tech-curse-is-he-right

Peter Thiel says California suffers from a “tech curse”. Is he right?

Speaking recently at the National Conservatism Conference in Miami, Peter Thiel, an investor and intellectual, made a provocative argument. He suggested that California suffers from a “tech curse”: a play on the “resource curse”, the notion that countries with abundant natural resources often have weak economies and corrupt political systems. If data is the new oil, then California is the new Saudi Arabia—even, he said, if things aren’t quite “as bad as Equatorial Guinea”.

Mr Thiel made the Equatorial Guinea comparison with tongue firmly in cheek, but he was deadly serious about the tech-curse theory. At first glance it seems plausible. California’s tech industry has in recent years produced astonishing wealth. The state is also in many ways dysfunctional. Parts of downtown San Francisco resemble an open-air drug den. Many of the state’s public schools seem keener on talking about social justice than teaching children. Each year, one in every 100 Californians, on net, leaves for another state.

Mr Thiel thinks that California’s poverty and prosperity are two sides of the same coin, with state and local governments providing the link. Public-sector employees draw on tech’s enormous tax revenues to overpay themselves and do no work, he says. The state’s tech moguls in effect buy off politicians, ensuring, for example, that they enact super-restrictive planning regulations to keep house prices high.

It is in vogue to criticise both California and tech: doing both at the same time left the audience in raptures. There is also a grain of truth to what Mr Thiel says. But there are two big problems with his theory.

Peter Thiel says California suffers from a tech curse. Is he right?: Extended Excerpt Image 1


Take the benefits offered by California’s tech industry first. Tech has, in fact, turned the state into a growth superstar, not a laggard. In the past five years, California’s state-level gdp has grown by 18%, the fourth-fastest rate in the country and a better performance than either Florida or Texas (see chart). Even subtracting tech, California’s growth was above average, according to our calculations. Less fashionable industries such as chemicals manufacturing have also done well in recent years.

Many of the proceeds of this growth have gone on enormous mansions in Atherton and Los Altos, but they have also trickled down to a greater extent than Mr Thiel appreciates. Just over a decade ago the median Californian household had an income 7% higher than the median American one. Now their income is 15% higher. The unemployment rate, relative to the national average, has fallen. So has poverty. And there is little to suggest that the decline in joblessness or poverty is caused by poor people leaving the state.

Mr Thiel also overstates tech’s costs. It is true that some of California’s politicians behave with nearly as much impunity as the Saudi elite. Yet anyone with a passing knowledge of Californian history knows that dirty dealing in politics long predates tech. San Francisco’s politics today is tame in comparison with the 1970s.

It is similarly hard to blame tech for California’s housing market. The ratio of California’s average house price to America’s is much lower than in the mid-2000s. Meanwhile, California’s anti-building rules, the cause of sky-high prices, emerged with the environmentalist movement of the 1970s, not Mark Zuckerberg and Elon Musk. There is a lot to dislike about Big Tech, but it is not as malign as Mr Thiel believes.

Ed Comment: Add tech curse—I like that it shows the calif middle class out earn the us middle class. I argue the us middle class benefits from the greater productivity of America’s most talented workers. If that’s true, one would expect the calif middle class to out earn the us middle class and it does.

  • Government Spending
  • Fiscal Policy
    • Taxation
  • GDP
    • Business Cycle
    • Growth
  • Politics


Loading More Posts

End of content

No more pages to load

© Copyright 2026 Coherent Research Institute · All Rights Reserved · Privacy · Terms