Edward Conard

Top Ten New York Times Bestselling Author

  • “…a must-read for serious students of economic policy.” - Glenn Hubbard, Dean, Columbia Business School, and former Chairman of the Council of Economic Advisers
  • “Unintended Consequences is far smarter and more thought-provoking than most economics written for the general public” - Greg Mankiw, Harvard University, Former Chairman of the Council of Economic Advisors
  • “Unintended Consequences represents the most cogent and persuasive analysis of the Financial Crisis to date.” - Andrei Shleifer, 1999 John Bates Clark Medal Winner
  • “…challenges misconceptions that distort our economic debates.” - Arthur Brooks, President of the American Enterprise Institute
  • “There are an amazing number of good ideas and interesting points made in Unintended Consequences. The thinking underlying it, and the obvious depth of understanding of the author, are very impressive.” - Steven Levitt, coauthor of Freakonomics; 2004 John Bates Clark Medal
  • “Unintended Consequences should be read by anyone who takes for granted the superiority of progressive taxation and has not thought carefully about the trade-offs involved.” - The New Republic
  • “…serious thinking for serious thinkers. …a thought-provoking blueprint for growing middle- and working-class incomes.” - Mitt Romney, former Governor of Massachusetts
  • “…a comprehensive explanation of the modern economy.” - Julian Robertson, Founder, Tiger Management
  • “…challenges misconceptions that distort our economic debates.” - Arthur Brooks, President of the American Enterprise Institute
  • “A full-throated defense of economic dynamism.” - The Wall Street Journal
  • “…a very valuable contribution.” - Larry Summers, former Secretary of the Treasury and director of the National Economic Council, president emeritus, Harvard University
  • “Unintended Consequences provides a provocative interpretation of the causes of the global financial crisis and the policies needed to return to rapid growth. Whether you agree or not, this analysis is well worth reading.” - Nouriel Roubini, New York University; Chairman, Roubini Global Economics
Upside of Inequality Oxford Unintended Consequences
Buy the Books
  • Macro Roundup
  • About Roundup
  • About Ed Conard
  • Highlights
  • Topics
  • Subscribe
Edward Conard
  • twitter
  • facebook
  • linkedin
  • youtube

Macro Roundup

  • Email
  • Text Message (SMS)
  • Twitter/X
  • LinkedIn
  • Facebook
  • WhatsApp Message
Subscribe to Macro Roundup Emails
Select topics to choose: articles that mention them (broader) or articles mainly about them (focused)
  • Mentions 0
  • Primary focus 0
Showing all 7,320 Macro Roundup articles
When you search for any topic (like GDP, Inflation, or Banking), choose:
Choose search scope

Tuesday, September 20, 2022

Dont Believe the Hype About Antarcticas Melting Glaciers

AI Summary. Antarctica's ice sheet holds 26.5m gigatons of water, and annual losses rose from 40 gigatons in the 1980s to 250 gigatons in the 2010s — about 0.001% of the total — a pace that would raise sea levels roughly 3 inches over 100 years. Media coverage exaggerates these findings and omits that past glacier retreats were faster.

Steven Koonin Wall Street Journal
Date Posted:
September 20, 2022
Is Database:
Database

Recent media reports on Antarctic glaciers misrepresent scientific findings, exaggerating the rate of ice loss & its implications. Annual losses have increased from 40 gigatons in the 1980s to 250 gigatons in the 2010s, 0.001% of total ice.

Recent media reports on Antarctic glaciers misrepresent scientific findings, exaggerating the rate of ice loss & its...

Is Antarctic ice loss smaller than media coverage suggests?

Core argument: Antarctic annual ice losses rose from 40 gigatons in the 1980s to 250 gigatons in the 2010s, equal to 0.001% of the ice sheet's 26.5m gigatons of water.

Recent media reports on Antarctic glaciers misrepresent scientific findings, exaggerating the rate of ice loss and its implications. While the Antarctic ice sheet holds 26.5m gigatons of water, annual losses have increased from 40 gigatons in the 1980s to 250 gigatons in the 2010s, representing only 0.001% of total ice. If this rate continues, sea levels would rise by just 3 inches over 100 years. Studies show past glacier retreats were faster than today, and potential ocean current connections could increase discharge by 10% by century's end. However, media often sensationalizes these findings, ignoring nuances and leading to public misinformation. Accurate understanding of these complex processes is crucial for informed climate policy decisions.
Takeaways by Macro Roundup® AI

  1. Antarctic annual ice losses rose from 40 gigatons in the 1980s to 250 gigatons in the 2010s, equal to 0.001% of the ice sheet's 26.5m gigatons of water.
  2. Continuation of that rate of Antarctic ice loss would raise sea levels by about 3 inches over 100 years.
  3. Studies indicate past Antarctic glacier retreats were faster than today's, and potential ocean current connections could increase discharge by 10% by century's end.

“…Two recent studies reported in the media focus on the terminus of glaciers—i.e., where the ice, the ocean and the ground come together. One study used an underwater drone to map the seabed at a depth of 2,000 feet, about 35 miles from the terminus of the Thwaites Glacier in Antarctica. Detailed sonar scans showed a washboard pattern of ridges, most less than 8 inches high. The ridges are caused by daily tides and serve as a record of where ice touched the seabed in the past. Researchers could read that record to infer that at some time in the past the glacier retreated for half a year at more than twice the fastest rate observed between 2011 and 2019. The cause of the specific event at the Thwaites Glacier remains unknown, in part because the time of the rapid retreat hasn’t yet been determined. It likely happened more than 70 years ago, if not several centuries ago. But the media goes with this angle: “A ‘doomsday glacier’ the size of Florida is disintegrating faster than thought.” A correct headline would read: “Thwaites Glacier retreating less than half as rapidly today as it did in the past.”A second study tested the idea that freshwater from the melting of one glacier could be carried by currents along the shore to accelerate the discharge of nearby glaciers. Because global climate models are insufficiently detailed to describe the ocean near the coast, researchers constructed a special model to prove out their idea. If ocean currents can connect the discharges of distant glaciers, that would add to the complexity and variability of changes in the Antarctic ice sheet. …”

Steven Koonin, "Don’t Believe the Hype About Antarctica’s Melting Glaciers,"Wall Street Journal, September 20, 2022, https://www.wsj.com/articles/dont-believe-the-hype-about-antarcticas-melting-glaciers-ice-sheet-climate-change-global-warming-sea-levels-greenland-iceberg-ocean-11663618509

Don’t Believe the Hype About Antarctica’s Melting Glaciers

Alarming reports that the Antarctic ice sheet is shrinking misrepresent the science under way to understand a very complex situation. Antarctica has been ice-covered for at least 30 million years. The ice sheet holds about 26.5 million gigatons of water (a gigaton is a billion metric tons, or about 2.2 trillion pounds). If it were to melt completely, sea levels would rise 190 feet. Such a change is many millennia in the future, if it comes at all.

Much more modest ice loss is normal in Antarctica. Each year, some 2,200 gigatons (or 0.01%) of the ice is discharged in the form of melt and icebergs, while snowfall adds almost the same amount. The difference between the discharge and addition each year is the ice sheet’s annual loss. That figure has been increasing in recent decades, from 40 gigatons a year in the 1980s to 250 gigatons a year in the 2010s.

But the increase is a small change in a complex and highly variable process. For example, Greenland’s annual loss has fluctuated significantly over the past century. And while the Antarctic losses seem stupendously large, the recent annual losses amount to 0.001% of the total ice and, if they continued at that rate, would raise sea level by only 3 inches over 100 years.

Many fear that a warming globe could cause glaciers to retreat rapidly, increasing discharge and causing more rapid sea-level rise. To get beyond that simplistic picture, it is important to understand how glaciers have flowed in the past to predict better whether they might flow faster in the future.

Two recent studies reported in the media focus on the terminus of glaciers—i.e., where the ice, the ocean and the ground come together. One study used an underwater drone to map the seabed at a depth of 2,000 feet, about 35 miles from the terminus of the Thwaites Glacier in Antarctica. Detailed sonar scans showed a washboard pattern of ridges, most less than 8 inches high. The ridges are caused by daily tides and serve as a record of where ice touched the seabed in the past. Researchers could read that record to infer that at some time in the past the glacier retreated for half a year at more than twice the fastest rate observed between 2011 and 2019.

The cause of the specific event at the Thwaites Glacier remains unknown, in part because the time of the rapid retreat hasn’t yet been determined. It likely happened more than 70 years ago, if not several centuries ago. But the media goes with this angle: “A ‘doomsday glacier’ the size of Florida is disintegrating faster than thought.” A correct headline would read: “Thwaites Glacier retreating less than half as rapidly today as it did in the past.”

A second study tested the idea that freshwater from the melting of one glacier could be carried by currents along the shore to accelerate the discharge of nearby glaciers. Because global climate models are insufficiently detailed to describe the ocean near the coast, researchers constructed a special model to prove out their idea. If ocean currents can connect the discharges of distant glaciers, that would add to the complexity and variability of changes in the Antarctic ice sheet.

Under scenarios deemed likely by the United Nations’ Intergovernmental Panel on Climate Change, a connection between ocean currents and discharge would increase the overall discharge rate in one region of the continent by some 10% by the end of the century. But to emphasize the idea being tested, the modelers used human influences almost three times larger. Even though that fact is stated in the paper, reporters rarely catch such nuance, and the media goes with headlines such as “Antarctic Ice Melting Could Be 40 Percent Faster Than Thought” with the absurd statement that “a massive tsunami would swamp New York City and beyond, killing millions. London, Venice and Mumbai would also become aquariums.” A more accurate headline would read: “Ocean currents connecting antarctic glaciers might accelerate their melting.”

These two studies illustrate the progress being made in understanding a dauntingly complex mix of ice, ocean, land and weather, with clever methods to infer past conditions and sophisticated computer modeling to show potential future scenarios. These papers describe the science with appropriate precision and caveats, but it is a shame that the media misrepresents the research to raise alarm. That denies the public the right to make informed decisions about “climate action,” as well as the opportunity to marvel at the science itself.

Mr. Koonin is a professor at New York University, a senior fellow at the Hoover Institution and author of “Unsettled: What Climate Science Tells Us, What It Doesn’t, and Why It Matters.”

  • Global Warming
  • Science

Thursday, September 29, 2022

U.S. government debt is not a ticking time bomb

AI Summary. Paying 3.5% interest on debt worth 120% of GDP imposes a burden comparable to the mid-1990s, when rates were near 7% and debt was about half as large relative to GDP. With the Federal Reserve expected to cut rates and inflation eroding the debt's real value, interest costs are projected to rise but remain manageable.

Noah Smith Noahpinion
Date Posted:
September 29, 2022
Is Database:
Database

Paying 3.5% interest on 120% of GDP is comparable to borrowing costs in the mid-1990s, when interest rates were around 7%.

Is the interest burden on government debt still manageable?

Core argument: Paying 3.5% interest on U.S. debt equal to 120% of GDP is comparable to borrowing costs in the mid-1990s, when interest rates were around 7% and debt was about half as large relative to GDP.

Paying 3.5% interest on 120% of GDP is comparable to borrowing costs in the mid-1990s, when interest rates were around 7%. Despite the U.S. debt being about twice the size relative to GDP compared to the 90s, the current interest rate environment is not as dire as it seems. The Federal Reserve anticipates cutting rates, which will moderate interest costs. Inflation is also eroding the debt, reducing its real value over time. Consequently, while interest costs are expected to rise, they are not projected to reach catastrophic levels. Instead, they may return to mid-90s levels, which is manageable. This suggests that U.S. government debt is not a ticking time bomb, although some fiscal austerity may be prudent to manage future costs effectively.

Takeaways by Macro Roundup® AI

  1. Paying 3.5% interest on U.S. debt equal to 120% of GDP is comparable to borrowing costs in the mid-1990s, when interest rates were around 7% and debt was about half as large relative to GDP.
  2. The Federal Reserve is expected to cut rates, which would moderate U.S. interest costs, while inflation erodes the real value of outstanding debt over time.
  3. U.S. interest costs are projected to rise but not to catastrophic levels, instead returning toward manageable mid-1990s levels, though some fiscal austerity may be prudent.

"..we’ll have to roll over about half of our government debt over the next 4 years or so. And we’ll have to roll it over at higher interest rates. So far, yields are only back up to the levels of the mid-2000s, and not yet back to 90s levels. But there are two problems here: Borrowing costs might go up more, as the Fed is forced to hike interest rates more and more in order to bring inflation down. We have to pay interest on a much bigger pile of government debt than we did in the 90s and 2000s…. As a percentage of GDP, our debt is about twice what it was in the halcyon days of the 90s and early 00s. That means paying 5% interest on that debt would be as costly as paying 10% interest would have been back in 1995 or 2005. (The story is similar if you look at debt as a percent of tax revenues.) So if something doesn’t change in the next 4 years or so, we could easily be paying 80s levels of interest costs on the federal debt….In the 80s, interest costs reached an astounding 50% of tax revenue! …Two silver linings So why am I not alarmed? Well, two reasons. First, interest rates probably aren’t going to stay high for that long. The Fed currently predicts that it will start cutting rates in 2023. And markets expect this to happen too:This will moderate the rise in interest costs a bit. Paying 3.5% interest on 120% of GDP will only be as painful as paying 7% interest would have been in the 90s. And in fact borrowing costs were about that high in the mid-90s. So this really isn’t too bad. And if inflation drops back to pre-pandemic levels, we can lower interest rates even more. The second reason for calm is that inflation itself is eroding the debt. Notice how government debt as a percent of GDP has been going down for the last couple of years? Part of that is GDP growth, but part of that is just inflation. The government kept borrowing money, but the entire existing debt stock was shrinking in real terms. The result is that in inflation-adjusted terms, government debt didn’t even rise in 2021 or 2022: In other words, we’re going to exit the current inflationary era with more expensive debt, but on a somewhat smaller amount of debt. And that debt erosion is permanent, even though higher interest rates will probably be temporary.Therefore I do see increased interest costs in our future, but not as apocalyptic as Druckenmiller says. A return to the costs of the mid-90s seems reasonable….”

Noah Smith, "U.S. government debt is not a ticking time bomb,"Noahpinion, September 29, 2022, https://noahpinion.substack.com/p/us-government-debt-is-not-a-ticking

U.S. government debt is not a ticking time bomb

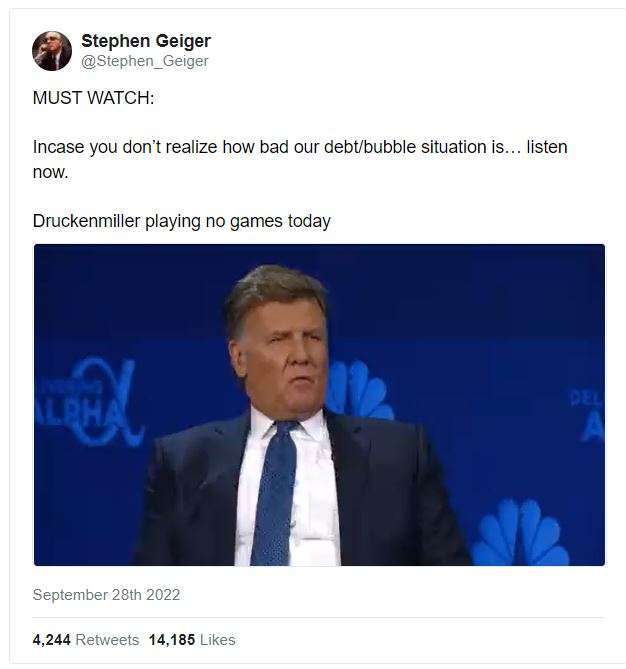
Some folks asked me to write a post about whether the U.S. debt is a ticking time bomb. They were alarmed by this viral video of retired hedge fund manager Stanley Druckenmiller declaring that U.S. debt service costs are about to eat the rest of the budget:

U.S. government debt is not a ticking time bomb: Extended Excerpt Image 1


Now, Druckenmiller is not a perennial prophet of doom and gloom, nor is he a perma-hawk who always warns that deficits and/or inflation are about to destroy the economy. He correctly warned of inflation as early as September 2020, but he does not appear to be one of the people who (wrongly) warned that quantitative easing would cause inflation back in the early 2010s. A lot of finance-industry macro guys will tell the crowd what they want to hear, but Druckenmiller seems like a straight shooter.

What’s more, some of his concerns are clearly appropriate. Higher interest rates will raise the amount of money that the U.S. government has to spend on debt service, and that will crowd out other types of government spending. And in the long run, we will probably have to either make cuts to entitlement benefits or find significant new sources of cost reduction, which can be a politically tricky thing to do.

Personally, though, I think things aren’t nearly as bad as Druckenmiller thinks. U.S. interest costs won’t rise catastrophically in the short term, and there’s not really a reason to expect interest rates to stay high for decades. Furthermore, inflation will itself erode some of the national debt, reducing long-term interest costs relative to GDP.

It does seem clear, though, that increased interest costs — and the Fed’s unwillingness to finance higher government borrowing — will force a bit of austerity in the years to come.

Interest costs are going up, but it’s not that bad yet

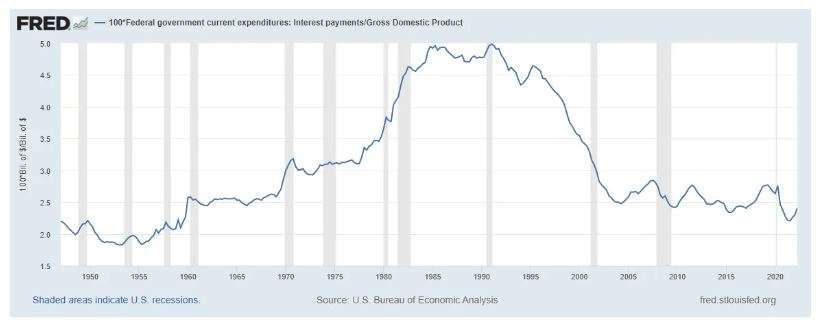
Here’s a long-term history of how much the federal government pays in interest payments, as a percent of GDP:

U.S. government debt is not a ticking time bomb: Extended Excerpt Image 2


You can see that interest costs fell during and after the pandemic and have now started to rise again. But they’re a long way from being anywhere close to what they were in the 1980s, when they reached almost 5% of GDP.

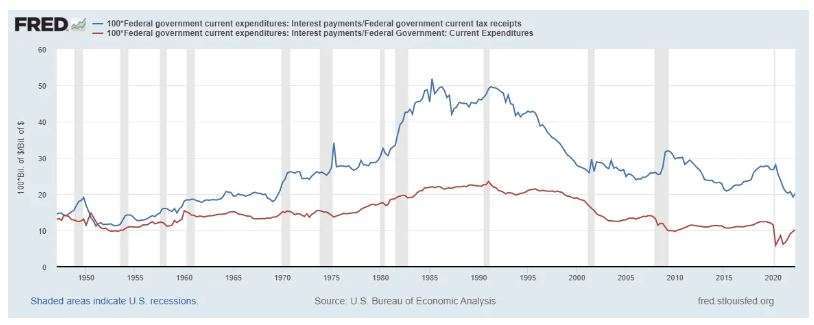
Now let’s look at interest payments as a percent of tax revenue and as a percent of government spending:

U.S. government debt is not a ticking time bomb: Extended Excerpt Image 3


In the 80s, interest costs reached an astounding 50% of tax revenue! This is because we raised interest rates in the 80s while also cutting taxes. For better or for worse, Reagan was not a particularly fiscally responsible President.

Right now, interest payments haven’t even begun to rise as a percent of tax revenue, and one big reason is inflation. Interest rates are set in dollar amounts, and inflation increases the number of dollars in the economy, meaning that tax revenues increase in dollar terms as well. That makes it easier for the government to make its interest payments. Remember, inflation erodes debt of all kinds.

The problem: rolling over the debt

So right now, interest costs are fine. But if interest rates keep going up, then interest costs will rise. The reason is that the U.S. government has to roll over its debt as the bonds reach maturity. And as it rolls over debt, it will have to borrow at a higher interest rate.

Now, this doesn’t happen all in one fell swoop. Not all of our government debt has to be rolled over immediately. If the government issued a 20-year bond in 2020 at near 0% interest rates, interest costs on that debt won’t go up for 18 more years. Right now, we have a bunch of outstanding bonds that were all issued at different times, and at different maturities. Figuring out how fast our existing debt needs to be rolled over actually takes some serious work.

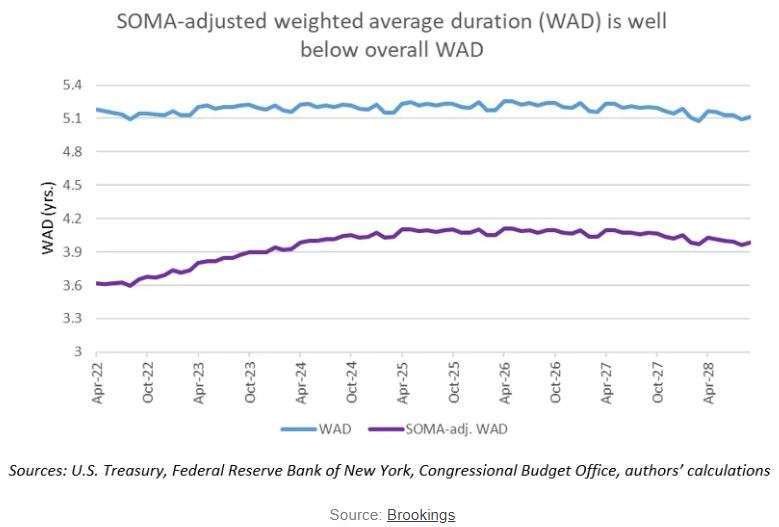
Fortunately, a team at Brookings has recently done this work. They found that the weighted average duration (WAD) of outstanding Treasury debt is a little over 5 years. And when you count “SOMA” debt that the Treasury owes to the Fed (which you probably should, since the Fed isn’t going to forgive that debt), the weighted average duration is only about 4 years.

U.S. government debt is not a ticking time bomb: Extended Excerpt Image 4


It seems like a big mistake to me that we didn’t borrow at longer maturities to lock in low interest rates for a very long time. In fact, we kept making this mistake right into the spring of 2021, when inflation had already started to accelerate. Had we had the foresight to lock in low rates for decades, we would be facing much less of an interest cost problem in the 2020s. But anyway, here we are.

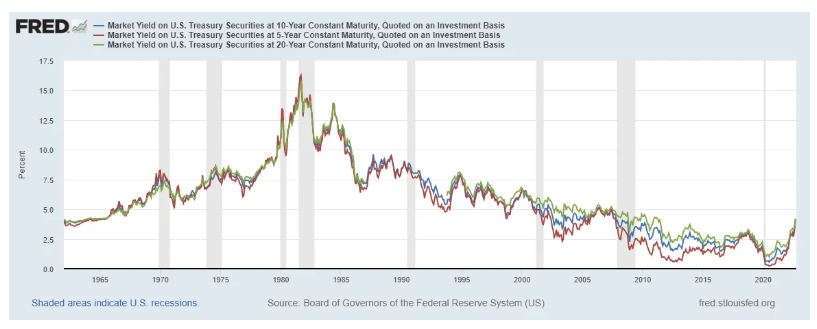
So we’ll have to roll over about half of our government debt over the next 4 years or so. And we’ll have to roll it over at higher interest rates. Here’s a historical chart of yields for 5-year, 10-year, and 20-year Treasury bonds, just to give you an idea of what we’re facing:

U.S. government debt is not a ticking time bomb: Extended Excerpt Image 5


In historical terms, this really doesn’t look that bad. So far, yields are only back up to the levels of the mid-2000s, and not yet back to 90s levels. But there are two problems here:

Borrowing costs might go up more, as the Fed is forced to hike interest rates more and more in order to bring inflation down.

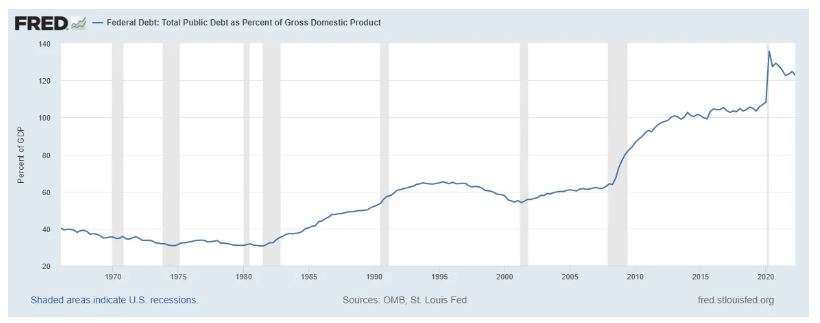
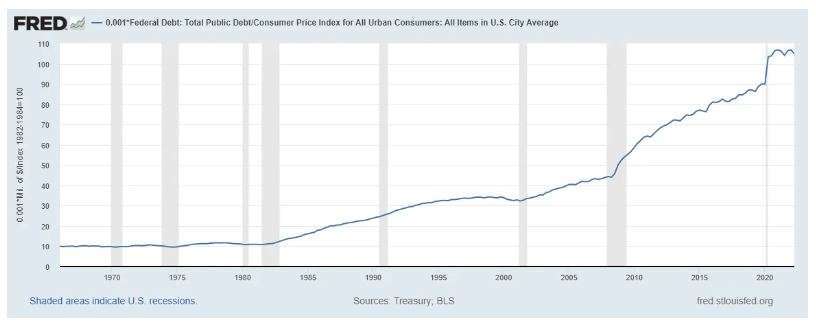
We have to pay interest on a much bigger pile of government debt than we did in the 90s and 2000s. Here’s government debt as a percent of GDP:

U.S. government debt is not a ticking time bomb: Extended Excerpt Image 6


As a percentage of GDP, our debt is about twice what it was in the halcyon days of the 90s and early 00s. That means paying 5% interest on that debt would be as costly as paying 10% interest would have been back in 1995 or 2005. (The story is similar if you look at debt as a percent of tax revenues.)

So if something doesn’t change in the next 4 years or so, we could easily be paying 80s levels of interest costs on the federal debt. In this sense, Druckenmiller’s warning is right.

Two silver linings

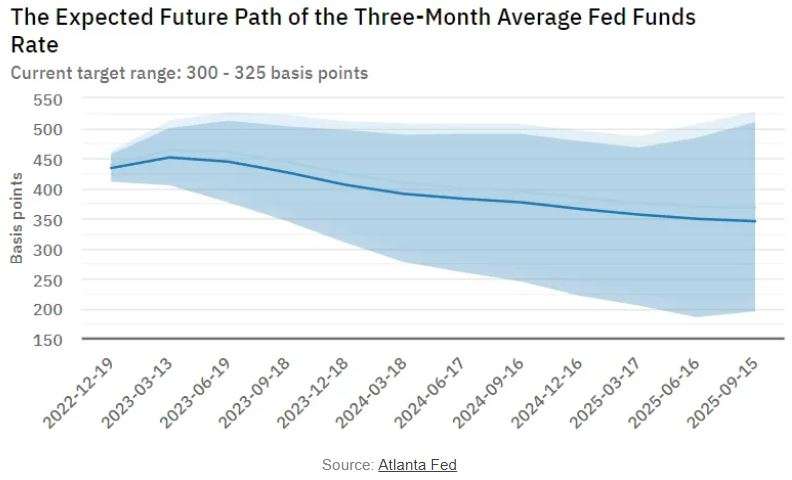
So why am I not alarmed? Well, two reasons. First, interest rates probably aren’t going to stay high for that long. The Fed currently predicts that it will start cutting rates in 2023. And markets expect this to happen too:

U.S. government debt is not a ticking time bomb: Extended Excerpt Image 7


This will moderate the rise in interest costs a bit. Paying 3.5% interest on 120% of GDP will only be as painful as paying 7% interest would have been in the 90s. And in fact borrowing costs were about that high in the mid-90s. So this really isn’t too bad. And if inflation drops back to pre-pandemic levels, we can lower interest rates even more.

The second reason for calm is that inflation itself is eroding the debt. Notice how government debt as a percent of GDP has been going down for the last couple of years? Part of that is GDP growth, but part of that is just inflation. The government kept borrowing money, but the entire existing debt stock was shrinking in real terms. The result is that in inflation-adjusted terms, government debt didn’t even rise in 2021 or 2022:

U.S. government debt is not a ticking time bomb: Extended Excerpt Image 8


In other words, we’re going to exit the current inflationary era with more expensive debt, but on a somewhat smaller amount of debt. And that debt erosion is permanent, even though higher interest rates will probably be temporary.

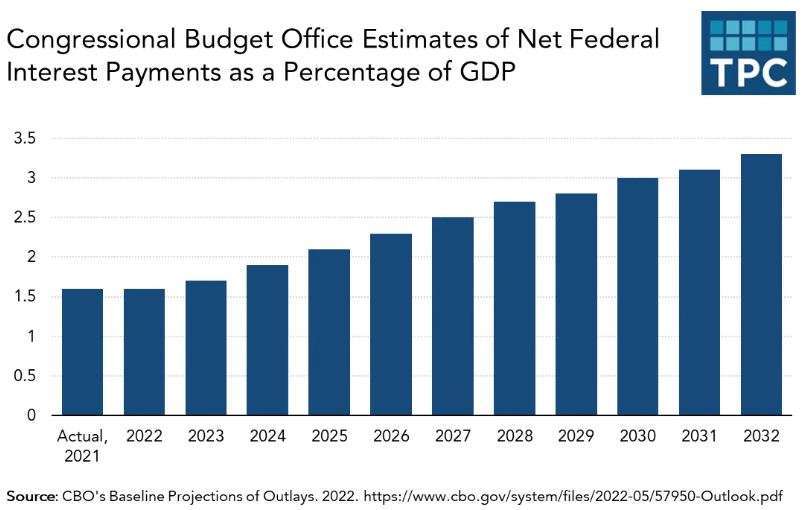
Therefore I do see increased interest costs in our future, but not as apocalyptic as Druckenmiller says. A return to the costs of the mid-90s seems reasonable. And in fact, this is exactly what the Congressional Budget Office projected, back in May:

U.S. government debt is not a ticking time bomb: Extended Excerpt Image 9


That’s not exactly a ticking time bomb.

But although I don’t think we’re headed for a debt-service catastrophe, I do think it would be wise to engage in a little bit of fiscal austerity over the coming decade.

A little bit of austerity won’t hurt

Fiscal austerity will accomplish a couple of purposes. First, it’ll help hold down debt service costs, and second, it will help bring inflation down faster.

During the long slow recovery from the financial crisis and the Great Recession, “austerity” became a dirty word, and with good reason. With borrowing costs ultra-low and the economy far below its potential, there was every reason to borrow cheaply and spend on fiscal stimulus, and countries that chose to ignore this imperative tended to suffer as a result.

But now, a decade later, the situation has changed entirely — the economy is running hot, borrowing costs are higher and rising, and inflation is the big problem. Both basic Keynesian theory and financial reality say that in the current situation, the government should cut back. The UK is now finding out what can happen when a government pushes its fiscal luck too far. We’re in a stronger place than the UK, but that doesn’t mean we’re infinitely strong. Cutting back a bit is only prudent.

But what spending can we cut?

First, let’s talk about entitlements. Most of this is Social Security, Medicare, and Medicaid. When folks like Druckenmiller warn of the dangers of long-term debt, they often talk about how entitlements are projected to explode in cost. The CBO is sort of complicit in this, as it regularly releases deficit projections that show debt going up exponentially starting any day now.

But these projections always assume two things: First, that we won’t cut Social Security, and second, that health care costs will keep increasing at historic rates. Neither of these is likely to be true. They say Social Security is the third rail of politics, but when the system was about to become unsustainable in the past, we quietly raised the retirement age. It’s likely that we’ll do this again. As for health costs, these are a problem whether they’re paid by the private sector or the public sector. But as it happens, health costs as a percentage of GDP have leveled off recently. So it’s quite possible — even likely — that the age when health care costs went up and up has come to an end.

But if entitlements aren’t really going to eat the economy, they also probably won’t get cut by very much. Nor will other social spending, much of which is also health care. If we can bring down health care costs, that will be a big deal (and I’ll talk a lot about this in an upcoming post). But it’s unlikely that we’ll slash government health benefits outright.

And as much as we’d all like to live in an era of peace, defense spending will also have to go up, due to the return of great-power conflict. We need to not only replenish the munitions we’ve been sending to Ukraine, but also bolster our forces for the possibility of an imminent conflict over Taiwan, as well as raise spending on the military modernization efforts that we’re undertaking to match Chinese power in the 2030s.

So if social spending is going to hold steady and defense spending are going to increase, how do we get austerity? The answer is “taxes”. Since World War 2, federal tax revenue has fluctuated between about 15% and 20% of GDP. We’re now at the middle of that range. So we’re going to have to go to the top of that range for a little while.

Higher taxes are painful, and much of that pain will inevitably be borne by the middle class as well as the rich. But that’s the cost of maintaining a welfare state while also protecting the country against external threats. Having a nation is simply an expensive proposition. For a long time, rock-bottom interest rates let us get away with ignoring that cost. That era is now over.

  • Government Spending
  • Fiscal Policy
    • Fiscal Deficits
    • Taxation


Loading More Posts

End of content

No more pages to load

© Copyright 2026 Coherent Research Institute · All Rights Reserved · Privacy · Terms