


Do corporate tax cuts boost long-run growth more than personal tax cuts?
Core argument: Corporate income tax cuts raise real GDP by 0.5%, with the increase persisting over a decade alongside gains in R&D spending and productivity that peak roughly eight years after the shock.
Corporate income tax cuts, while initially modest in impact, lead to significant and persistent increases in R&D spending and productivity, with effects peaking around eight years post-shock. This sustained R&D response is a key driver of long-term GDP growth, as evidenced by a 0.5% increase in real GDP persisting over a decade. In contrast, personal income tax cuts yield large but short-lived boosts to output and productivity, with effects dissipating within two years. The disparity in outcomes is further highlighted by the fact that corporate tax changes have larger long-term effects on GDP and productivity in 93% and 98% of cases, respectively, compared to personal tax changes. This suggests that corporate tax policy is more effective for long-term economic stimulus through its influence on innovation and productivity.




Ed Comment, “I am skeptical of this study. If you treat an untreated population with education, who gains the most? …smart uneducated people who become educated. Smart people underperform their potential until they are educated. A potentially lower scorer won’t gain as much from education (calculus for example). The fact that the gains lined up with statistically significant demographics (i.e., Asians > whites > Hispanics > blacks) requires my hypothesis to be tested. And yet it was not. Or at least, it wasn’t reported. It's also interesting the correlation between 7thand 11th/12 grade scores is 74%. That’s shockingly high. My guess is that the test reliability is highest for a sample of moderately high scorers like this.”
Steve Comment, “they don’t have a table showing the absolute gains by the initial distribution. Note they define academic growth "relative change in academic achievement, as measured by a standardized test, from Grade 7 to Grade 11/12"They gauge this via"ACT test scores from 7th grade and 11th or 12th grade were used to measure academic growth."They don’t seem to use different baseline.”
The Sample
“…The sample consists of 482,418 students who took the ACT test in 7th grade and again in 11th or 12th grade and were projected to complete high school between 1996 and 2017...The mean 7th grade ACT Composite score was very similar for students who sent their scores to a talent search program (17.7) and those who did not (17.8). Thus, we included all students in the sample and considered them academically advanced, even if they did not send their scores to a talent search program...The sample can be compared with the general population of 11th grade students (as of 2016) in the United States on gender, race/ethnicity, geographic region, school type, and school locale (Table 1)...."
"...or this study, we used students’ 7th-grade scores and last scores from high school. The correlation of 7th grade and later ACT Composite scores was r =.74, suggesting that using the ACT for a younger but academically advanced population results in scores that agree well with those from the typical use of ACT scores for students in Grade 11 or 12. Additional validity evidence for using ACT scores for advanced 7th grade students is documented elsewhere (ACT, 2017). The mean (standard deviation ) number of months between the 7th-grade test and high school test was 55.1 (3.5), or about 4.6 years. Although some students take the ACT test multiple times in high school, we chose to only use students’ last scores to maximize the length of the follow-up period and to better capture effects of intervening variables (e.g., coursework, grades, and extracurricular activities) that could manifest throughout high school. Because ACT scale scores are equated, a student’s score from 7th grade can be directly compared with their score from 11th or 12th grade. One measure of growth is the gain score (later ACT score - 7th grade ACT score). This measure is attractive for its simplicity and intuitive appeal but suffers from ceiling effects (students with high 7th grade scores have less room to grow), regression to the mean (e.g., the lowest scoring students in 7th grade have the largest mean gains), and high standard error of measurement...."The residual gain score (Castellano & Ho, 2013) is an alternative to the simple gain score and is calculated as the residual from a regression of the later test score on the earlier test score. The residual gain model belongs to the same family of conditional status models as other popular growth models, including the student growth percentile model (Betebenner, 2009) and value-added models (Castellano & Ho, 2015). The regression model can be a simple linear model, a higher order polynomial model, or even a categorical model. Because of our large sample (and sufficient sample size at each 7th grade score point), we used a categorical model. Relative to gain scores, residual gain scores often have lower standard error of measurement. Demonstrating this model, Figure 1 plots the mean 11th/12th grade ACT Composite score for each possible 7th grade ACT Composite score (solid black line). For example, among students who had an ACT Composite score of 15 in 7th grade, the mean ACT Composite score in grade 11/12 was approximately 24. Therefore, a student who scores 15 in 7th grade is expected to score a 24 in 11th/12th grade. A student who scores 15 in 7th grade and 30 in 11th grade (depicted by the star in Figure 1) has a gain score of 15 (30-15) and a residual gain score of 6 (30-24).The residual gain model addresses regression to the mean because average gain is allowed to vary across the score scale. In Figure 1, mean gain scores are represented by the distance between the solid black line and the line of no gain (the dashed black line); regression to the mean is illustrated by the distance between the two lines shrinking as grade 7 ACT Composite score increases.The ceiling effect is represented by the “room to grow” distance (e.g., the difference between the top of the grade 11/12 score scale and the dashed black line) shrinking as Grade 7 ACT Composite score increases. Academically advanced students are more likely than general population students to hit the ACT score ceiling in Grade 11/12, but it is still a rare occurrence: In our sample, 1,181 students (0.24%) had an ACT Composite score of 36….”
"... Across all students and cohorts, the mean and standard deviations were 17.7 (3.1) for the 7th-grade ACT Composite score, 26.7 (4.1) for the 11th/12th-grade ACT Composite score, 9.0 (2.7) for the gain score, and 0.0 (2.7) for the residual gain score. Whereas “conditional status” is a more precise descriptor of what is measured by the residual gain score, we use the term “growth” throughout the paper for simplicity. The correlation of simple gain score (change in absolute performance) and residual gain score (change in relative performance) was r =.99, suggesting that there is little practical difference between these two types of growth measures...."
Results
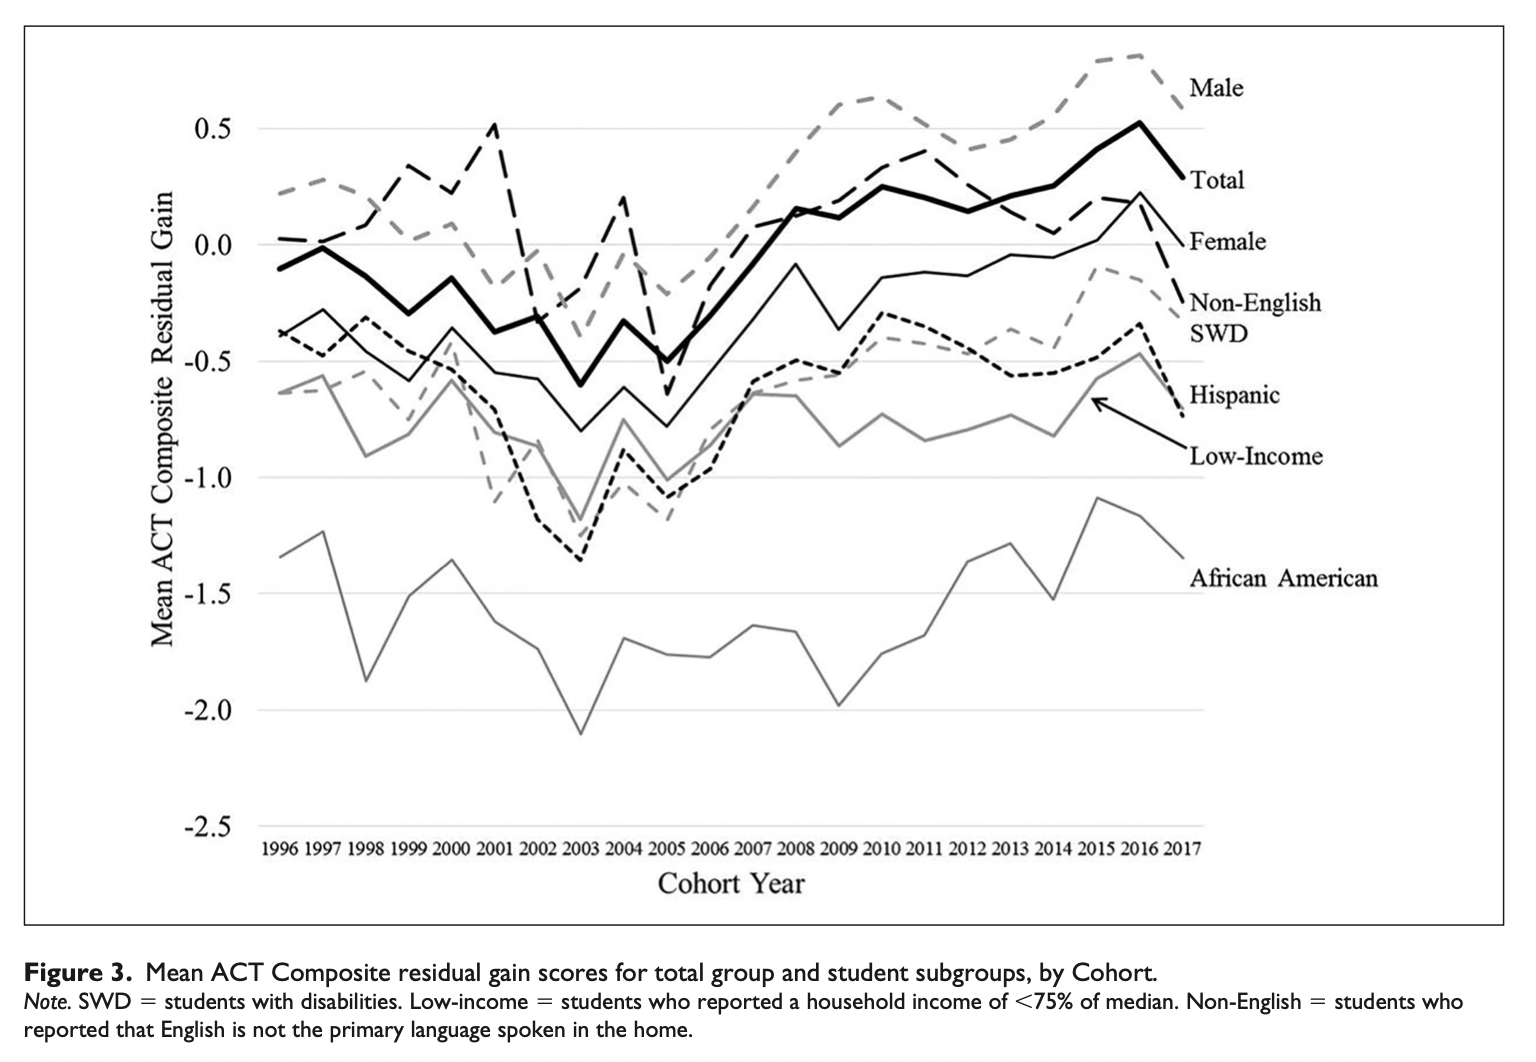
"...To address RQ1, we first plotted the mean growth scores (residual gain ACT Composite scores) by cohort year (Figure 2). By definition, the mean growth score is 0 in the total group. There was a general downward trend in growth from 1996 to 2005, and the mean growth score was at its lowest point (−0.60) for the 2003 cohort. From 2005 to 2017, there was a consistent upward trend in growth, and the mean score was at its highest point (0.53) for the 2016 cohort. Because the trend was different for 1996 to 2004 and 2005 to 2017, we conducted three separate trend tests: 1996 to 2017 (entire study period), 1996 to 2004 (early period of the downward trend), and 2005 to 2017 (later period of the upward trend)...."
"... Over the entire study period, mean growth from 7th to 11th/12th grade improved by 0.035 units per year for academically advanced youth (Table 3, p <.001). This improvement can be translated to ACT Composite score points over the entire study period by multiplying the coefficient by the number of years (21), translating to 0.74 (0.035 × 21 years) ACT Composite score points from 1996 to 2017.The improvement can also be translated to an effect size measure, such as Cohen’s d. For example, the standard deviation of ACT Composite scores among all ACT-tested high school graduates is 5.6 (ACT, 2016), so the improvement is comparable to an effect size of about 0.13 (0.74/5.6), which is simi- lar to Cohen’s benchmark for a “small” effect (Cohen, 1988). For the later period (2005-2017), mean growth improved by 0.062 units per year and for the earlier period (1996-2004), mean growth decreased by 0.052 units per year. The results suggest that academic growth from 7th to 11th/12th grade among academically advanced youth has improved over the past two decades, with the improvement occurring over the past 13 years. The average gain (difference score) in ACT Composite score from grade 7 to grade 11/12 was 9 points, which translates to about two points per academic year. This provides a benchmark for comparing the improvement with growth that is typically obtained from one year of instruction: The improvement of 0.74 ACT Composite score points over the 22-year period is comparable to students in 2017 having received an extra 0.37 year of instruction, relative to students in 1996 (calculated as 0.74/2.00)...."