Edward Conard

Top Ten New York Times Bestselling Author

  • “…a must-read for serious students of economic policy.” - Glenn Hubbard, Dean, Columbia Business School, and former Chairman of the Council of Economic Advisers
  • “…a fresh argument for the productive value of inequality.” - David Autor, Professor of Economics, Massachusetts Institute of Technology
  • “…a comprehensive explanation of the modern economy.” - Julian Robertson, Founder, Tiger Management
  • “Unintended Consequences offers deep and well-argued analyses on almost every issue.” - The New York Times
  • “…challenges misconceptions that distort our economic debates.” - Arthur Brooks, President of the American Enterprise Institute
  • “Unintended Consequences is far smarter and more thought-provoking than most economics written for the general public” - Greg Mankiw, Harvard University, Former Chairman of the Council of Economic Advisors
  • “…serious thinking for serious thinkers. …a thought-provoking blueprint for growing middle- and working-class incomes.” - Mitt Romney, former Governor of Massachusetts
  • “…challenges misconceptions that distort our economic debates.” - Arthur Brooks, President of the American Enterprise Institute
  • “…a fresh argument for the productive value of inequality.” - David Autor, Professor of Economics, Massachusetts Institute of Technology
  • “A full-throated defense of economic dynamism.” - The Wall Street Journal
  • “…serious thinking for serious thinkers. …a thought-provoking blueprint for growing middle- and working-class incomes.” - Mitt Romney, former Governor of Massachusetts
  • “…a very valuable contribution.” - Larry Summers, former Secretary of the Treasury and director of the National Economic Council, president emeritus, Harvard University
Upside of Inequality Oxford Unintended Consequences
Buy the Books
  • Macro Roundup
  • About Roundup
  • About Ed Conard
  • Highlights
  • Topics
  • Subscribe
Edward Conard
  • twitter
  • facebook
  • linkedin
  • youtube

Macro Roundup

  • Email
  • Text Message (SMS)
  • Twitter/X
  • LinkedIn
  • Facebook
  • WhatsApp Message
Subscribe to Macro Roundup Emails
Select topics to choose: articles that mention them (broader) or articles mainly about them (focused)
  • Mentions 0
  • Primary focus 0
Showing all 7,294 Macro Roundup articles
When you search for any topic (like GDP, Inflation, or Banking), choose:
Choose search scope

Wednesday, September 8, 2021

Unsheltered Homelessness: Trends, Characteristics, and Homeless Histories

AI Summary. Homeless populations declined in most US states, including large drops in Florida and Texas, while New York and California saw substantial increases, which the authors attribute to factors such as greater tolerance and policy changes including bail and jail release. New York City's unsheltered homeless count fell 38% to 2,376.

Samantha Batko, Alyse D. Oneto and Aaron Shroyer Urban Institute
Date Posted:
September 8, 2021
Is Database:
Database

Btw 2007 and 2020, the homeless population declined across most U.S. states, with notable exceptions in New York (NY) and California (CA), where homelessness increased significantly.

Do state policies explain why homelessness rose in some states?

Core argument: Between 2007 and 2020 the U.S. homeless population declined across most states, with New York and California the notable exceptions, where homelessness rose significantly, while Florida and Texas recorded large drops.

Between 2007 and 2020, the homeless population declined across most U.S. states, with notable exceptions in New York (NY) and California (CA), where homelessness increased significantly. While states like Florida (FL) and Texas (TX) experienced large drops, NY and CA saw substantial rises, driven by factors such as increased tolerance and policy changes like bail/jail release. In NY, despite a decline in shelter use from July 2020 to June 2021, the overall homeless numbers have risen since 2012. The unsheltered homeless population in NYC decreased by 38% to 2,376 in 2020, yet the broader state trend remains upward. This divergence highlights the complex interplay of local policies and economic conditions affecting homelessness trends.
Takeaways by Macro Roundup® AI

  1. Between 2007 and 2020 the U.S. homeless population declined across most states, with New York and California the notable exceptions, where homelessness rose significantly, while Florida and Texas recorded large drops.
  2. New York City's unsheltered homeless population fell 38% to 2,376 in 2020, even as New York State's overall homeless numbers have risen since 2012.
  3. The increases in New York and California are attributed to factors including greater tolerance and policy changes such as bail and jail release.

First, it seems like homelessness is going down nationally (graph later), but is increasing in NY and CA (these are state numbers). The graph below shows the increase in homelessness from 2007 to 2020. The pink is 2020 and the grey is 2007. You can see here that NY and CA are the only two states where homelessness has significantly increased. Other states like MA, MN and DC have seen smaller rises in homelessness while FL and TX have seen large drops in homelessness. This graph was presented onUSAFACTS.org(https://usafacts.org/data/topics/people-society/poverty/public-housing/homeless-population/) and the data were taken from HUD.

Second, I’ve been looking at NYC’s Department of homeless Services website (https://www1.nyc.gov/site/dhs/about/stats-and-reports.page). They have reports on the monthly number of homeless in shelters. It looks like there has been a steady decline in people in shelters from Jul-20 to Jun-21 (the latest numbers).

This is a pattern we see in other years as well, however, the overall level of homeless in shelters seems to have come down a little as well. I’ve included both FY 2020 and FY 2018 so you could get a sense of the overall level of homeless in shelters per-pandemic (2019 looked broadly similar):

That said, these recent numbers are up from the beginning of the available data (FY 2012):

One issue with these NYC numbers is that they are recording people in shelters - but there could be a significant number of unsheltered homeless people. (Note the NYT hasreportedthere are~ 2,000 homeless people sleeping on the streets/subways in Manhattan) The city is alsostarting to tacklethe problem more aggressively, “…"...On some days, city workers clear dozens of encampments. Advocates said that the sweeps are doing harm by upending homeless residents’ lives through aggressive tactics that discourage people from seeking or accepting the city’s help. “They are trying to make life so miserable on the streets that people will come into shelters, but that is a cruel and ineffective approach,” said Josh Dean, the founder ofHuman.nyc, a policy group focused on street homelessness...Still, the city has increased its number of cleanups during the pandemic. In 2020, from March 1 to Dec. 12, the city performed 1,077 cleanups, compared with 543 during the same period in 2019, according to figures the city released in response to a Freedom of Information Act request from the Safety Net Project of the Urban Justice Center. This year, between January and March 23 — even before the city ramped up the effort in May — there were 873 sweeps, compared with 94 sweeps in the same period in 2019..."

As to why homelessness seems more prevalent now, I have a theory but it’s not backed up by anything: During Covid, the city gathered the homeless in empty hotels for their safety and to stop the spread of covid. These hotels were empty because there were not tourists. Now the homeless have been kicked out of these hotels, but the tourists have not come back. I think the homeless are still fanning out from their collection points (the hotels) so they’re more concentrated than they once were AND, because tourism isn’t back to pre-covid levels/people aren’t back, the homeless make up a much larger percentage of the people you see than they used to. They basically stick out more. Again, this isn’t based on any of the numbers collected by that’s my current working hypothesis.

Overall it seems like national homelessness is going down while NYS homelessness is going up. However, while NYS homelessness is increasing, NYC homelessness is decreasing in both the sheltered and unsheltered communities with the latest numbers.

Neither number looks much like an outlier so it seems plausible to me.

According to the HOPE survey, there has been a 38% decrease in the unsheltered homeless population in NYC to 2376 with an implied unsheltered homeless population of ~3830 in 2020. Adding these two values to the graph I made (above) we have the graph below:

For the most recent data, the City has something called the HOPE Survey (Homeless Outreach Population Estimate;https://www1.nyc.gov/assets/dhs/downloads/pdf/hope-2021-results.pdf).

These data, however, only go through 2019 and are not as up to date as we’d like.

All that said, their report does say that overall homelessness is declining nationally:

Finally, from this report, is something I find heartening. In NYC it seems like all the unsheltered homeless are individuals as opposed to families (including children). The same cannot be said for other “hot spots” around the country:

And that homelessness is going up marginally in NYS compared to the real homeless hot spots out west:

The Urban Institute also has a report using these HUD data (https://www.urban.org/sites/default/files/publication/103301/unsheltered-homelessness.pdf). According to their report, it’s really the west coast that has the homeless problem, not the East coast:

From the graph, you can see we are currently above the long run average, but not by a lot - by about 400 people throughout the whole city.

I found HUD estimates of unsheltered homeless by county (https://www.hud.gov/2019-point-in-time-estimates-of-homelessness-in-US). I have taken NYC CoC (the geographical unit HUD uses for counting the homeless) and graphed unsheltered homeless per year (2007-2019) and graphed the average over that time frame:

From those numbers it suggests the city could be characterized as asleep at the switch in terms of homelessness going into pandemic?

Ed Comment 1/2: Why is "homelessness" growing or at least becoming a lot more visible? (They're all up and down Madison Ave). Population growth is slow, presumably the share of mentally ill/homeless isn't growing, and we are supposedly providing more money /housing. So they seem to be coming from somewhere else. If so, from where and why. Perhaps they were on "skid row"/out-of-sight and are now " allowed" on Madison's Ave. Perhaps higher benefits from NY and CA lured them from other places. Who has done serious thinking on this (I'm sure there is lots of partisan BS on this), and what do they say?

Ed Comment 2/2: Since it only seems to be increasing in CA and NY (and probably in a few other liberal cities), my guess is that it's related to a combination of increased tolerance and the bail/jail release. I think the jails are full of mentally ill. And a few more dangerous people in the gathering points of the homeless may drive many others out. Danger in shelters often seems cited as a reason for not using them. Consistent with that, we see a decline in shelter use. It wasn't clear if that's US of NY. A small change in national could be driven by a large change in local. I also think tolerance plays a big role. If you let them shelter on Madison Ave store fronts, why wouldn't they? If you let them pitch an urban tent, some people will economize on rent. Campgrounds are full of eager campers.

We couldn’t find anything that I would consider good research on homelessness. As you said, there were lots of things that seemed political (on the left things like income/wealth inequality and on the right things like easing police policy etc). Nothing that did a plausible job, in my estimate, of explaining the phenomena. But I did find some decent data that I’ll present here that give a good snapshot of what homelessness looks like right now in America (and NYC).

  • Historical
  • Workforce
    • Poverty/Crime

Your Fall 2021 syllabus

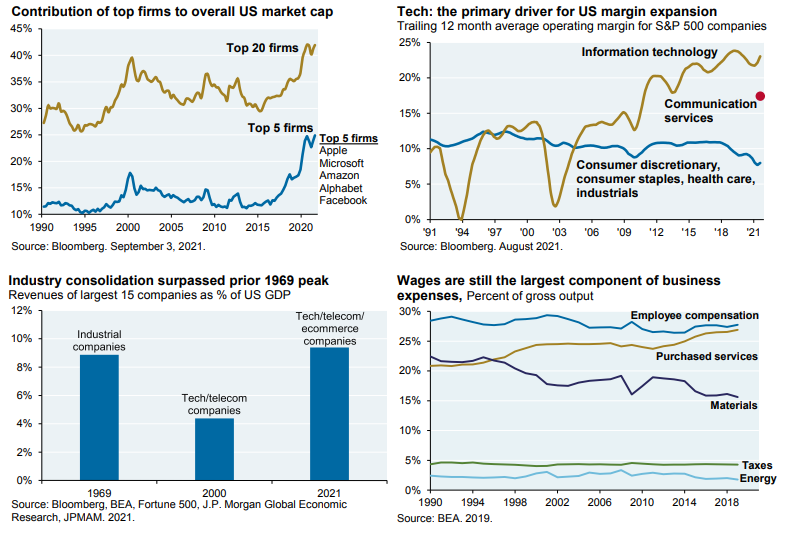
AI Summary. S&P 500 industry concentration reached an all-time high, drawing antitrust scrutiny, while gains in technology and communications extended beyond the five largest firms. With wages the largest component of business expenses, companies are increasingly using technology to lower unit labor costs and raise productivity, which the author argues will sustain demand for technology goods and services.

Michael Cembalest J.P. Morgan
Date Posted:
September 8, 2021
Is Database:
Database

Tech plays a pivotal role in shaping corporate strategies & maintaining robust operating margins. Trailing 12 Month Average Operating Margin For S&P 500 Companies 1991-October 2021.

Will rising wage costs sustain business demand for technology?

Core argument: Industry concentration reached an all-time high over the period measured, drawing antitrust scrutiny.

The trailing 12-month average operating margin for S&P 500 companies from 1991 to October 2021 highlights significant economic trends. During this period, industry concentration reached an all-time high, drawing antitrust scrutiny. Despite this, the tech and communications sectors expanded beyond the five megacap firms, with secular growth tech stocks performing comparably to megacaps in 2021. As wages remain the largest component of business expenses, companies increasingly rely on tech to reduce unit labor costs and boost productivity. This trend suggests sustained demand for tech goods and services, with no expected mean reversion in sector profit margins. The data underscores the pivotal role of technology in shaping corporate strategies and maintaining robust operating margins amidst evolving economic conditions.

Takeaways by Macro Roundup® AI

  1. Industry concentration reached an all-time high over the period measured, drawing antitrust scrutiny.
  2. Tech and communications sector gains in 2021 extended beyond the five megacap firms, with secular growth tech stocks performing comparably to the megacaps.
  3. With wages the largest component of business expenses, companies increasingly rely on technology to reduce unit labor costs and raise productivity, a trend that suggests sustained demand for tech goods and services and no mean reversion in sector profit margins.

Some good factoids on concentration from JPM’s Michael Cembalset, "...Industry concentration is at an all-time high and is attracting antitrust attention. But the tech/communications services opportunity set is much bigger than the 5 megacap firms: secular growth tech stocks we discussed in our 2021 Outlook are performing in line with the megacap stocks this year, and carry a lot less antitrust baggage. As long as wages are the largest component of overall business expenses (last chart), the corporate sector will look to tech companies to help reduce their unit labor costs and improve productivity. In other words, we expect strong demand for technology goods and services to continue, and do not expect any mean reversion in sector profit margins...."

Your Fall 2021 syllabus: Extended Excerpt Image 1


Michael Cembalest, "Your Fall 2021 syllabus," J.P. Morgan, September 7, 2021, https://privatebank.jpmorgan.com/content/dam/jpm-wm-aem/global/pb/en/insights/eye-on-the-market/fall-2021-syllabus.pdf

Ed Comment: Doesn’t it suggest the IT sector is a significant cause of declining labor share? I also think that “software is eating the world.” Most every company’s product has a growing IT component of its value added/revenue. If that component looks like the IT sector, then IT is affecting labor’s share beyond the IT sector. How did you tag the labor share summary? Tag this to coincide with that.

  • Productivity
    • Institutional Capabilities
    • Intangibles
  • Comparisons
    • Historical
    • Sector
  • GDP
    • Financial Markets

Thursday, September 9, 2021

Joshua Brault and Hashmat Khan

AI Summary. Income inequality is associated with a statistically significant negative relationship (at the 1% level) with determinants of the natural rate of interest, consistent with the theory of indebted demand. The authors find minimal correlation between income inequality and the trend growth rate of natural output, with estimates not statistically different from zero.

Joshua Brault Straub
Date Posted:
September 9, 2021
Is Database:
Database

Evidence supports “indebted demand” theory, showing income inequality exerts downward pressure on natural rates of interest (r*).

Does income inequality push down the natural rate of interest?

Core argument: Brault and Khan find a negative relationship between income inequality and other determinants of the natural rate of interest, significant at the 1% level, supporting the theory of indebted demand.

The theory of indebted demand suggests that income inequality exerts downward pressure on natural rates of interest (r*). Analysis reveals a strong negative relationship between income inequality and other determinants of r*, significant at the 1% level, supporting this theory. Figure 3's decomposition of the natural rate shows minimal correlation between income inequality and the trend growth rate of the natural rate of output, with OLS estimates not statistically different from zero. However, the significant negative relationship between income inequality and other determinants of r* underscores the impact of inequality on economic dynamics, aligning with Mian, Straub, and Sufi's 2021 findings. This evidence highlights the macroeconomic implications of rising income inequality, emphasizing its role in shaping interest rate trends and economic policy considerations.

Takeaways by Macro Roundup® AI

  1. Brault and Khan find a negative relationship between income inequality and other determinants of the natural rate of interest, significant at the 1% level, supporting the theory of indebted demand.
  2. Brault and Khan's decomposition of the natural rate shows minimal correlation between income inequality and the trend growth rate of the natural rate of output, with OLS estimates not statistically different from zero.
  3. Brault and Khan's evidence on inequality and the determinants of r* aligns with Mian, Straub, and Sufi's 2021 finding that income inequality exerts downward pressure on natural rates of interest.

"...Our interpretation of the Mian, Straub and Sufi (2021) story is that if inequality is exerting downward pressure on natural rates of interest, this should appear in the latter component of the natural rate, zt. To this end, Figure 3 presents the decomposition of the natural rate where we plot the relationships between: (1) income inequality and the estimated trend growth rate of the natural rate of output; and (2) income inequality and other determinants of r?, that is, zt. The top panel in Figure 3 quite clearly shows a minimal relationship between income inequality and trend growth rates of the natural rate of output. OLS estimates of income inequality on trend growth rates are not statistically different from zero by any conventional standard. In sharp contrast, the bottom panel of Figure 3 shows a strong negative relationship between other determinants of the natural rate of interest and income inequality. This relationship is significant at the 1% level. Our findings lend support to the central prediction of the theory of indebted demand proposed in Mian, Straub and Sufi (2021), that income inequality is putting downward pressure on natural rates of interest...."

Joshua Brault and Hashmat Khan: Extended Excerpt Image 1


Joshua Brault and Hashmat Khan, "Some International Evidence on Indebted Demand," Carleton University, September 2, 2021, https://carleton.ca/economics/wp-content/uploads/cewp21-10.pdf

Ed Comment: “I’m not sure I understand the paper on inequality and interest rates, which I would like to include. Four questions. First, is the regression/data US or worldwide? Second, how do they separate the fact that as the world, chiefly China, has gotten richer, it has also saved more? Similarly, as the US has gotten richer the world has also saved more, flooded the US with risk-averse savings, and the rate has declined. They are correlated, but is it causal? How do they stake their claim that it’s casual? Third, I’m not sure I understand the 2 graphs. Of the top graph, the text says: “Figure 3 quite clearly shows a minimal relationship between income inequality and trend growth rates of the natural rate of output.” I thought the (mian) theory is that richer people save more rather than consume. We lack uses for investing all the savings (in effect a Keynesian paradox of thrift). So the interest rate declines to equilibrate. Is so, then doesn’t (the growth in) demand have to decline to reduce the rate? If declining rates equilibrate the supply and demand for savings, why do we care? An increase in savings would increase investment, which would presumably accelerate growth/increase productivity/raise standards of living. It only seems like a problem if it produces a Keynesian paradox of thrift, i.e. if demand declines (is correlated with inequality). Help me understand their story. Fourth, how do they differentiate between risk-averse savings that results in debt and risk-bearing equity? let’s say I insist on holding more low-risk debt for every dollar of risky equity I invest. (risk-bearing investors hold about 70% equity, not 100%) Low rates might be a “necessary evil,” and the resulting slowdown from any paradox of thrift might be offset by an acceleration of growth (relative to the counterfactual). I’m not sure how to interpret the results.”

Ben/Steve Comment:” Ed: First, is the regression/data US or worldwide? Ben: The Brault/Khan note that was in the newsletter today is a comment on a Mian, Straub, and Suffi “Indebted Demand” paper (attached) The regression run in this comment is on international data (Australia, Canada, EuroZone, Norway, UK, and US). The indebted demand paper also uses international data but averages the data across countries. There is another Mian, Straub and Suffi paper called “The saving glut of the right and the rise in debt”. Steve did a write up of that paper before I joined. (Also attached) That paper focuses on the US. Ed: Second, how do they separate the fact that as the world, chiefly China, has gotten richer, it has also saved more? Similarly, as the US has gotten richer the world has also saved more, flooded the US with risk-averse savings, and the rate has declined. They are correlated, but is it causal? How do they stake their claim that it’s casual? Ben:The short answer here is: they don’t. First, China and other countries developing countries (India, etc) don’t even appear in the data. Secondly they use time fixed effects to control for global trends like those you’re describing. “Indebted Demand” uses “motivating facts” (not causal estimation) to motivate its model and then inequality drives interest rates within the model. This paper is not really an empirical exercise. Finally, in the savings glut of the rich, Mian, Straub, and Suffi have this explicit warning: "we acknowledge up front that there is no specific source of exogenous variation in the rise in inequality used in this study,” which is to say, these are not causal estimates.Ed: Third, I’m not sure I understand the 2 graphs. Of the top graph, the text says: “Figure 3 quite clearly shows a minimal relationship between income inequality and trend growth rates of the natural rate of output.” I thought the (mian) theory is that richer people save more rather than consume. We lack uses for investing all the savings (in effect a Keynesian paradox of thrift). So the interest rate declines to equilibrate. Is so, then doesn’t (the growth in) demand have to decline to reduce the rate? If declining rates equilibrate the supply and demand for savings, why do we care? An increase in savings would increase investment, which would presumably accelerate growth/increase productivity/raise standards of living. It only seems like a problem if it produces a Keynesian paradox of thrift, i.e. if demand declines (is correlated with inequality). Help me understand their story. Ben:For the graphs: Equation 1 in Brault/Khan paper says the natural rate of interest is the growth rate (g) plus other stuff (what they call z). The first panel shows the relationship between inequality and g and the second panel shows the relationship between inequality and z. The relationship between inequality and z is very strong and that’s what puts the downward pressure on the interest rate. The story really comes from the two Mian, Straub and Suffi papers previously mentioned. Their story is that, as the rich save more, they finance the consumption of the rest of the people in the economy. So the rich having lots of money is more of a supply story and less of a demand story in the lending markets (as you pointed out by describing the paradox of thrift). However, what Mian, Straub and Suffi are pointing out is that for every dollar saved by a rich guy, there is a dollar borrowed by a poorer guy (approximately, there are non-consumption-financing savings and equity etc, but to a first approximation). These borrowed dollars are exactly why demand (for goods and services) doesn’t go down. Ed: how do they differentiate between risk-averse savings that results in debt and risk-bearing equity? Ben: Today’s note doesn’t deal with anything like this. Both Mian, Straub and Suffi papers look at the net- debt position of rich households vs the net debt position of poorer households. This measure nets out equity - both intermediation and risk bearing equity - but doesn’t make distinctions finer than this. Steve: this all connects to research that Mian/Straub/Sufi presented at Jackson Hole (attached) that argues that the rise in inequality, rather than demographics has driven down the interest rates. The basic mechanism is the rich have a greater propensity to save and the resulting risk adverse capital drives down r*, note this study looks at the United States (so it’s not accounting for incoming hot money) Bottom line, "...Downward pressure on the natural rate of interest (r*) is often attributed to an increase in saving. This study uses microeconomic data from the SCF+ to explore the relative importance of demographic shifts versus rising income inequality on the evolution of saving behavior in the United States from 1950 to 2019. The evidence suggests that rising income inequality is the more important factor explaining the decline in r*. Saving rates are significantly higher for high income households within a given birth cohort relative to middle and low income households in the same birth cohort, and there has been a large rise in income shares for high income households since the 1980s. The result has been a large rise in saving by high income earners since the 1980s, which is the exact same time period during which r* has fallen. Differences in saving rates across the working age distribution are smaller, and there has not been a consistent monotonic shift in income toward any given age group. Both findings challenge the view that demographic shifts due to the aging of the baby boom generation explain the decline in r*...."
Ed Comment: “Two thoughts First what matters is at the margin. So the savings of the rich may increase, but if (productive) investment also rises then we don’t get the effects that concern M&S (increased consumption or Keynesian paradox of thrift). It only matters when savings are greater than investment. Savings could be greater than investment if we run trade deficits for example AND rich people save more. But it might be the case that, were it not for trade deficits savings would not be greater than investment. From my prior readings, Mian and Sufi, seemed eager/determined to attribute all the increase to a rise in domestic inequality. That seems distorted/overstated to me. I believe the rich save a greater share of their income. (Surprisingly, others have argued otherwise.) I think it matters greatly whether they are risk averse or risk underwriting. If savers are risk averse, they deposit money in the bank (or money markets) and it predominantly end up funding mortgages, which can increase consumption (now it increased government debt, which also increases consumption but not via the free market). Or if savers invest in risky equity, it can result in a speculative boom, which can accelerate innovation, as we read about recently, So, it could be the case that rich Americans are saving but their savings are fueling a speculative boom while (at the margin) risk-averse offshore savers fund mortgages, gov debt, and ultimately consumption. To make a credible case that the rich/growing domestic inequality are to “blame,” we have to show that 1) it’s Americans, not risk-averse offshore savers who are funding consumption and 2) that the value of any speculative boom is less than the problems stemming form an offsetting rise in domestic risk-averse savings. That is, speculators may logically hedge the risk of speculation by holding risk-averse savings. So the slow down from unborrowed savings may be less than the acceleration of the speculative boom. My hunch is that, were it not for trade deficits, the system would largely be in equilibrium. My sense of M&S is that they are either stupid (don’t see these issues) or don’t care because they have an ax to grind. For example, the correlate things to inequality while ignoring trade deficits. I’m not say that’s the case. I’m asking how they think through the issues I’m raising.”

Steve Comment: “In none of M&S stuff that I’ve read they have drawn or acknowledge a distinction btw risk adverse capital (ze Germans) and risk seeking equity (USA!) I thinkthis Mian quoteis helpful in understanding their worldview, “What is savings? We all know what it is at a personal level: I get 100$ check and might save 20$ out of it But what is savings in the aggregate? Say for the world as a whole? That's where it gets tricky. e.g. people talk about a "global saving glut". But can we measure it? Not really - at least not in a direct sense The reason is that when a person (say Adam) "saves", someone else (say Eve) uses that saving, i.e. "dissaves", by borrowing it and spending it for one purpose or another So, aggregate total saving is always exactly zero! Now you might say, that according to the world bank worldwide saving is about 25% of GDP historically. What is that number about? Well it is just an accounting convention! Someone somewhere decided (for some good reasons at the time), that if Eve spends Adam's savings on capital goods (i.e. "investment"), then we will not count it as dissaving. So what you get is an accounting identity: Saving = Investment What the world bank data is telling us is that historically Eve borrows and spends about 25% of GDP on investment goods. Now imagine something starts to change Adam starts to save more and more, call it his "saving glut" He needs Eve to borrow his additional savings He convinces her to do that, but only after making it cheaper for her to borrow by lowering his interest rate However, Eve is not interested in spending her additional borrowing on capital goods, or investment Instead Eve decides to "consume" it - throws a party, goes on vacation, that sort of stuff The accounting convention will start counting Eve's additional spending as dissaving What this all means is that even though Adam *is* saving a lot more than before, total saving measured by our accounting standards will remain the same. Yes, there is a "saving glut" - But aggregate national accounts will not show it! So if you really wanted to see the saving glut, you will have to see it indirectly You will see it as a rise in total credit (remember Eve is borrowing more and more), as a fall in interest rate, and as a rise in Adam's personal savings I think this is the world we actually live in now Adam is the top 1% And I have no idea why Eve does not invest more, but consumes her additional borrowing ps: in recent years government has been borrowing and spending on Eve's behalf... but same thing more or less”..."
Ed Comment: “A few thoughts. A lot of value gets captured by real estate. So eve may not save, but her real estate may nevertheless permanently rise in value as owners save, invest, take risk and innovate. She may borrow against the increased value of her home and consume the proceeds to adjust her desired amount of savings An investor might own stocks in companies that pour money into risky investments, and seem over valued. They may hold cash as an offset to manage their risk levels. I start by assuming the world is fairly logical. People determined to change the world/defeat the status quo start by assuming the world is mistaken/broken. They are confident they can out think markets/the economy, as if they could out-think nature and evolution. Most likely they are wrong because the world is too complex and their analysis is too simple to accurately account for all the tradeoffs.”

  • Inflation
  • Comparisons
    • Cross-country
    • Historical
  • GDP
    • Financial Markets
    • Savings Glut/Trade Deficit
  • Workforce
    • Inequality

Generational and Age Household Wealth Trends and Wealth Inequality

AI Summary. Millennials' average family wealth has caught up to Gen Xers' over the past five years after initially trailing, having been 6.4% below Gen Xers at the same age. Older age groups today hold more wealth than their predecessors did, indicating a steeper life-cycle path of wealth accumulation on average.

na Hernández Kent and Lowell R. Ricketts Federal Reserve Bank of St. Louis
Date Posted:
September 9, 2021
Is Database:
Database

Millennials’ average family wealth has caught up with Gen Xers over the past five years, despite initially trailing. Millennials had 6.4% lower wealth than Gen Xers at the same age in Q1 2005.

Have millennials caught up to earlier generations in household wealth?

Core argument: Millennials' average family wealth in Q1 2021 was 6.4% below that of Gen Xers at the same age in Q1 2005, after millennials' average wealth caught up to Gen Xers over the prior five years.

The analysis of generational wealth trends reveals that millennials, despite initially trailing Gen Xers, have seen their average family wealth catch up over the past five years. In Q1 2021, millennials' average wealth was 6.4% below that of Gen Xers at the same age in Q1 2005. Millennials had slightly lower family wealth than Gen Xers at age 32 and were below boomers at age 34, though their ages do not yet overlap in the data. The data underscores a generational wealth gap and highlights increasing inequality across the life cycle, with older groups today possessing more wealth than their predecessors, indicating a steeper life cycle of wealth accumulation on average. This trend suggests significant implications for economic policy and financial planning as wealth distribution continues to evolve across generations.

Takeaways by Macro Roundup® AI

  1. Millennials' average family wealth in Q1 2021 was 6.4% below that of Gen Xers at the same age in Q1 2005, after millennials' average wealth caught up to Gen Xers over the prior five years.
  2. Millennials held slightly lower family wealth than Gen Xers at age 32 and less than boomers at age 34, though millennial and boomer ages do not yet overlap in the data.
  3. Older age groups today hold more wealth than their predecessors did, indicating a steeper life cycle of wealth accumulation on average and rising inequality across the life cycle.

Generational and Age Household Wealth Trends and Wealth Inequality: Extended Excerpt Image 1


"...This figure shows average real family wealth of three different generations during their young- to mid-adult years. Values are centered on the median of the age range for the generation. For example, the median of the age range for millennials (born 1981-1996) in the first quarter of 2021 was 32 and Gen Xers (born 1965-1980) had a median age of 32 in the first quarter of 2005. While trailing Gen Xers for the beginning of their adult lives, millennials’ average family wealth has caught up over the past five years (as of the most recent data)..."

Generational and Age Household Wealth Trends and Wealth Inequality: Extended Excerpt Image 2


". Millennials had slightly lower family wealth, on average, than Gen Xers did at the same age (32) and were below boomers at age 34, though their ages do not yet overlap in the data. In the first quarter of 2021, millennials’ average wealth was 6.4% below Gen Xers’ wealth at the same age (Q1 2005)...."

Generational and Age Household Wealth Trends and Wealth Inequality: Extended Excerpt Image 3


"...The first two figures underscore a generational wealth gap. This figure highlights increasing inequality across the life cycle. Today, older groups have more wealth than older groups did in the past, signaling a steeper life cycle of wealth on average...."

Ana Hernández Kent and Lowell R. Ricketts, "Generational and Age Household Wealth Trends and Wealth Inequality," Federal Reserve Bank Of St. Louis, Updated July 22, 2021, https://www.stlouisfed.org/household-financial-stability/the-real-state-of-family-wealth/generational-and-age-household-wealth-trends-and-wealth-inequality

Ed Comment: Do we follower her? (She uses CPI instead of PCE (which reveals her bias) so her numbers are understated relative to the past). Add (headline graph in this link) to DB. Nite that she uses CPI. And my comments. Perhaps I'm misinterpreting her graph. She says younger generations are falling behind, but her summary data seems to indicate otherwise despite using CPI. Also seems younger generations have more college debt than prior generations (for degrees that don't seem likely to increase productivity). And there is also surely a mix shift toward demographics with lower test scores. Nor does it include the NPV of greater future gov retirement benefits, which seems likely to disincentivize saving.

  • Inequality
  • Workforce
    • Demographics
    • Wages/Income


Loading More Posts

End of content

No more pages to load

© Copyright 2026 Coherent Research Institute · All Rights Reserved · Privacy · Terms