Edward Conard

Top Ten New York Times Bestselling Author

  • “Unintended Consequences provides a provocative interpretation of the causes of the global financial crisis and the policies needed to return to rapid growth. Whether you agree or not, this analysis is well worth reading.” - Nouriel Roubini, New York University; Chairman, Roubini Global Economics
  • “…a comprehensive explanation of the modern economy.” - Julian Robertson, Founder, Tiger Management
  • “…challenges misconceptions that distort our economic debates.” - Arthur Brooks, President of the American Enterprise Institute
  • “Unintended Consequences offers deep and well-argued analyses on almost every issue.” - The New York Times
  • “…serious thinking for serious thinkers. …a thought-provoking blueprint for growing middle- and working-class incomes.” - Mitt Romney, former Governor of Massachusetts
  • “…serious thinking for serious thinkers. …a thought-provoking blueprint for growing middle- and working-class incomes.” - Mitt Romney, former Governor of Massachusetts
  • “A full-throated defense of economic dynamism.” - The Wall Street Journal
  • “…a fresh argument for the productive value of inequality.” - David Autor, Professor of Economics, Massachusetts Institute of Technology
  • “…a fresh argument for the productive value of inequality.” - David Autor, Professor of Economics, Massachusetts Institute of Technology
  • “…a must-read for serious students of economic policy.” - Glenn Hubbard, Dean, Columbia Business School, and former Chairman of the Council of Economic Advisers
  • “…a must-read for serious students of economic policy.” - Glenn Hubbard, Dean, Columbia Business School, and former Chairman of the Council of Economic Advisers
  • “…reminds us that inequality sends a signal of what society lacks most, in America’s case, entrepreneurship and risk taking.” - Lawrence Lindsey, CEO, The Lindsey Group, former Director of the National Economic Council
Upside of Inequality Oxford Unintended Consequences
Buy the Books
  • Macro Roundup
  • About Roundup
  • About Ed Conard
  • Highlights
  • Topics
  • Subscribe
Edward Conard
  • twitter
  • facebook
  • linkedin
  • youtube

Macro Roundup

  • Email
  • Text Message (SMS)
  • Twitter/X
  • LinkedIn
  • Facebook
  • WhatsApp Message
Subscribe to Macro Roundup Emails
Select topics to choose: articles that mention them (broader) or articles mainly about them (focused)
  • Mentions 0
  • Primary focus 0
Showing all 7,326 Macro Roundup articles
When you search for any topic (like GDP, Inflation, or Banking), choose:
Choose search scope

Friday, June 4, 2021

3 Myths About American Decline

AI Summary. Data show 70% of 30-year-olds are outperforming their parents on lifecycle economic measures, challenging claims that economic mobility has ended. The Gini coefficient of income inequality has been relatively stable since 1989 on an after-tax-and-transfer basis, inflation-adjusted median household income has risen about $25,000, and poverty rates have fallen.

Kaplan Winship Nick Gillespie Reason
Date Posted:
June 4, 2021
Is Database:
Database

70% of 30-year-olds are outperforming their parents in lifecycle economic achievements, challenging the belief that economic mobility has ended.

Do the data contradict claims of American economic decline?

Core argument: Data show 70% of 30-year-olds outperforming their parents on lifecycle economic achievements, challenging the claim that U.S. economic mobility has ended.

Contrary to popular narratives of economic stagnation, data reveals that 70% of 30-year-olds are outperforming their parents in terms of lifecycle economic achievements. This challenges the belief that economic mobility has ended. The Gini coefficient, a measure of income inequality, has remained relatively stable since 1989, especially when considering after-tax transfers. Additionally, inflation-adjusted median household income has risen by approximately $25,000 over the same period, while poverty rates have declined. These statistics suggest that economic conditions for younger generations are improving, undermining the notion of American decline.

Takeaways by Macro Roundup® AI

  1. Data show 70% of 30-year-olds outperforming their parents on lifecycle economic achievements, challenging the claim that U.S. economic mobility has ended.
  2. The Gini coefficient of U.S. income inequality has remained relatively stable since 1989, particularly when measured after taxes and transfers.
  3. Inflation-adjusted median household income has risen by roughly $25,000 since 1989 while poverty rates have declined, cutting against narratives of American economic stagnation.

Nick Gillespie, "3 Myths About American Decline," Reason, May 27, 2021, https://reason.com/video/2021/05/27/3-myths-about-american-decline/

3 Myths About American Decline

The American Enterprise Institute sociologist Scott Winship says that Americans are prone to believing "declension narratives," or stories about how the Golden Age ended sometime in the past and we have the bad luck to live in a world that is uniquely awful, unfair, and corrupt. Three of today's most prominent and influential declension narratives hold that we're having fewer children because they cost too much money, the rich have captured all the economic gains of the past several decades as income inequality has increased, and that economic mobility has effectively ended.

Winship says such stories are incomplete at best and completely false at worst. He finds that millennial women are more likely to hit their fertility goals than boomer women, strongly suggesting that having fewer children is a cultural choice, not an economic hardship. The Gini coefficient, which measures inequality, has stayed relatively flat since 1989, especially when after-tax transfers are taken into account. Over the same time period, the inflation-adjusted median household income has increased by about $25,000 even as poverty has declined. Contrary to scare stories about younger Americans doing worse than their parents, Winship finds that about 70 percent of 30-year-olds are doing better than their parents at the same age.

Ed Comment: Plz show me the evidence and analysis Winship uses to say 70% of today's children are better off than their parents. How does this compare to the 3 other studies I recall -- 2 that came out a few years ago around the sane time, one from Pew, I think, that said they were about the same, and the other from the Fed, I think, that said they were less, and the recent study that says workers take longer to mature in today's more complex world, but then earn more when they do?
Ben Comment:1) Winship on fertility goals and expensive kids:https://thedispatch.com/p/is-it-really-too-expensive-to-raise2) Winship discussing on the Gini coefficient and the inflation-adjusted median household income in the same piece:https://www.aei.org/articles/what-a-new-report-gets-wrong-about-economic-inequality/(it’s deep in the article and he’s citing a CBO report) 3) Winship refers to his previous research finding the 70% are better off than their parents here:https://www.aei.org/economics/is-the-united-states-still-a-land-of-opportunity-my-long-read-qa-with-scott-winship/but I cannot find the actual research. Steve, any ideas? I think the paper with the longer maturity of wage growth is the Demings paper (Attached but I’m not sure I did it properly, Steve - please attach in your normal way). Specifically, I think you want to look at figure 5. People are making more today because they’re more involved in “decision” making jobs as opposed to being managed. As for the other 2 - no idea.
Steve Comment:Demings writeup attached, the table Ben mentioned:

3 Myths About American Decline: Comments Image 1


I suspect Scott is referring to work (attached) in did in early 2018 that found Americans had a greater chance of exceeding their parents’ income than the usual suspects (Chetty et al.) suggest, but that they had a lower chance of transcending their parents’ rank in the income distribution

3 Myths About American Decline: Comments Image 2


I suspect Ed (let me know if I’m wrong) are referring the attached Fed/Pew studies, I also attached a Henry Grabar note when he attempted to reconcile the two (~)

Ed Comment:Thx. Is table 9 work that Winship did, or was he citing others? Is there a table like 9 that shows rank not income? If Americans had the same chance of exceeding their parent’s rank as other countries have, that would be astonishing given how much more disparate our test scores are and how much more disparate (and demanding) our jobs are. The returns to education are much higher in the US.
Steve Comment:Yes Figure 9 is his work, he doesn’t have a corresponding tables for rank, he does carve out male earning mobility which you might be interested in as men are seemingly more impacted by dysfunction than women

3 Myths About American Decline: Comments Image 3


Ed Comment:PPS why is everything indexed to 20-24 across all cohorts? Don’t I want everything indexed to a common number say 20-24 year olds in the first cohort? If everything isn’t indexed to the same number, how can I tell how 55 year olds today compare to ones in the 1960s? instead I see 55 in 1960 indexed to 24 year olds in 1960 and 55 year old 2017 index to 24 year olds in 2017. But what if 24 year olds are richer/poorer today than 24 year olds were in 1960? And isn’t the income of 24 years olds unreliable/variable/driven by a wider dispersion of factors? Isn’t 10 basically 9 for rank? Rank is what mobility is, no? doesn’t it say that the us is more mobile that most/all? Add this graph to the entry. Not the questions I my other email
Ben Comment:No, 9 looks at families and 10 only looks at males. They are looking at the same outcome but with different underlying populations. As for what they’re looking at, Winship says: “ studies mistakenly claim to be assessing “relative mobility”—the link between parent and child ranks—but are actually about “absolute mobility” (the link between parent and child income levels). “ He goes on to say: "Summary measures such as the intergenerational elasticity (IGE), intergenerational correlation (IGC), and the sibling correlation are conventionally, but wrongly, thought to summarize relative mobility. In fact, they summarize absolute mobility; they depend not only on relative mobility (changes in rank) but on changes in the cross-sectional distribution of incomes between generations.” So it seems like he’s saying these studies really look at how much more money kids make than their parents, even if they claim to be about rank. Looks like his preferred interpretation is families make a lot more than their parents did (table 9) and males make more than their fathers but not as much more as the families make. Demings table 5: He’s showing growth rates so the interpretation is each point is equal to log(wage_agebin)/log(wage_20yearold). It’s not exactly what Ed is most interested in but that’s the interpretation of the graph.

Steve Comment:Need to spend some time on this to think about reconciling the Winship /Demings/Pew/Federal Reserve data. First none of these are really apples to apples (in the way we built the apple core) in that for starters fewer millennials head households than the comps in prior generations, women have entered the labor force and demographics change (younger generation is much more diverse) plus as Deming’s points out, there now might be a lag in earnings. Ben noted that Demings is showing growth rates and Kaplan is showing total career earrings, so the base case really matters. But here is the snapshot(though note Pew’s $69,000 in 2017 for median household and the Fed’s $78,200 for married couples in 2014) aren’t that directionally that far apart.)

  • Inequality
  • Comparisons
    • Historical
  • Workforce
    • Wages/Income

A Goldilocks Theory of Fiscal Policy

AI Summary. The authors estimate the US can sustain government debt of up to 220% of GDP while interest rates stay below growth rates, but a permanent primary deficit of only 2% of GDP at debt of 109% of GDP. Projected deficits exceed that, implying future tax increases.

Amir Sufi Working Paper
Date Posted:
June 4, 2021
Is Database:
Database

The US can sustain a maximum government debt to GDP ratio of 220% within a “Goldilocks zone” where interest rates remain below growth rates, allowing for fiscal sustainability.

How much debt and deficit can the US sustain without tax increases?

Core argument: The US can sustain a maximum debt-to-GDP ratio of 220% within a "Goldilocks zone" where interest rates stay below growth rates, permitting fiscal sustainability without immediate tax increases.

The US can sustain a maximum government debt to GDP ratio of 220% within a "Goldilocks zone," where interest rates (R) remain below growth rates (G), allowing for fiscal sustainability without requiring immediate tax increases. However, this zone is fragile; factors like rising aggregate demand or declining growth can shrink it. The US can maintain a permanent primary deficit of 2% of GDP at a debt level of 109% of GDP, but current projections exceed this, with the Congressional Budget Office estimating an average primary deficit of 3.3% from 2021 to 2030. This suggests that any increase in debt above 109% of GDP would necessitate future tax hikes, challenging the notion of debt as a "free lunch."

Takeaways by Macro Roundup® AI

  1. The US can sustain a maximum debt-to-GDP ratio of 220% within a "Goldilocks zone" where interest rates stay below growth rates, permitting fiscal sustainability without immediate tax increases.
  2. The US can carry a permanent primary deficit of 2% of GDP at a debt level of 109% of GDP, while the Congressional Budget Office estimates an average primary deficit of 3.3% over 2021–2030.
  3. The Goldilocks zone is fragile, shrinking when aggregate demand rises or growth declines, and US debt above 109% of GDP would require future tax increases, challenging the idea of debt as a "free lunch.".

We though the new Mian/Straub/Sufi paper in today’s briefing would likely be something you would want to take a look at in more detail (note theEconomistalso wrote it in this week’s issue, link is also in briefing)

New Mian/Straub/Sufi makes an effort to estimate the sustainability of debt level/fiscal deficits in advanced economies. They argues there is a "Goldilocks zone" in which a State can run permanent deficits, in the case of the US it's, "...the United States’ Goldilocks zone has a maximum government debt to GDP ratio of 220%, at which point R rises above G; and a maximum permanent primary deficit of 2% of GDP obtained at the threshold debt level of 110% of GDP..."

However permanent deficits that it can turn dangerous if those deficits are used to"...address longer-run structural problems such as rising inequality and an aging population...."

Natural experiment provided by the Georgia Senate runoff, “…Our assumption in the calculation below is that the win by the two Democrats in the Georgia Senate election of January 5, 2021 increased the expected government debt by $2 trillion, which at the time was about 7.4% of total debt outstanding. Figure 13 shows the effect on the 10 year nominal interest rate, the 10 year TIPS interest rate, and expected inflation. As it shows the victory by the Democrats in the Georgia Senate election led to a 15 basis point immediate reaction which then declined to an 8 basis point reaction after a week. Taken together, these numbers imply that a 3.7% rise in total government debt outstanding relative to prior expectations led to an 8 basis point decline in G − R, which gives an estimate of ∂(G−R) ∂ log b of -0.022. The data for these calculations come from Bloomberg….”

A Goldilocks Theory of Fiscal Policy: Extended Excerpt Image 1


Atif Mian, Ludwig Straub and Amir Sufi, "A Goldilocks Theory of Fiscal Policy," Working Paper, June 2021, https://scholar.harvard.edu/files/straub/files/goldilocks.pdf

What the US looks like though this lens, “…The calibration suggests that the permanent primary deficit that the United States can run is z = 2.0% of GDP; it can run that at a debt level of b z = 109% of GDP; and the debt level at which R rises above G is b = 218% of GDP. These numbers are interesting against the backdrop that US government debt currently stands at around 126% as of the fourth quarter of 2020.15 According to this calibration, any increase in debt above 109% of GDP would have to be met by increases in taxes going forward (even if R remains below G).Moreover, note that even if debt remained stable at 109%, this would only allow the US government to run a 2% permanent deficit. As of March 2021, the average projected annual primary fiscal deficit to GDP ratio by the CBO for 2021 to 2030 is 3.3%. For 2021 to 2050, it is 3.9%. If the large projected deficit of 2021 is excluded, then the averages are 2.7% and 3.7%, respectively…”

The Goldilocks zone, ">... The steady states with debt levels between b ZLB and b in Figure 2 are situated such that the interest rate R lies above zero—and hence the economy is above the ZLB—but is not so large that the economy needs to run a primary surplus, i.e. R < G. We refer to this set of steady states as the Goldilocks zone. The Goldilocks zone represents a region of the state space in which the economy successfully avoids the ZLB on the one side and fiscally unsustainable deficits on the other. The latter presumes that the economy is able to sustain a steady state with R ≤ G, or in other words, is able to close any primary deficit. In that case, the Goldilocks zone corresponds to a “conservative” region of the state space that achieves fiscal sustainability. Alternatively, if a maximum amount of tax revenue τ is known, that could be used to derive an upper bound of the primary surplus x − τ. That upper bound could then be used to describe the upper limit of the Goldilocks zone, in lieu of b..."

What it implies for debt being a "free lunch", "...A stronger version of the “free lunch” idea is that permanent increases in deficits do not require tax increases going forward, even if they lead to permanently greater (non-explosive) debt levels....under the assumption of a constant interest rate R and a constant growth rate G > R. bt = − (G − R) bt + z describes a stable differential equation for debt b. This implies that temporary increases in deficits of arbitrary magnitude, leading to greater debt levels, can always be grown out of over time. Also, a permanent increase in deficits by some ∆z simply raises steady state debt levels by ∆z/(G − R), with no need for a reduction in deficits, i.e. an increase in taxes, at any point. Both versions of the free lunch property are satisfied with exogenous R and G in (17)…”

R and G aren’t independent“…In our model, R and G are endogenous to fiscal policy, and this has important implications for whether a free lunch policy is possible. Boosting deficits leads to high debt levels, which raise interest rates because the convenience premium on government debt declines when the market is saturated. In contrast, excessively conservative fiscal policy leads to weak aggregate demand and nominal interest rates being trapped at the zero lower bound, depressing both real output and nominal growth G. As a result, the condition R < G can be violated either because debt levels are high and convenience premia low, or because debt is low with R pinned at zero and G falling below zero due to deflation. The endogeneity of R and G to government debt levels implies that a simple examination of the difference between the two at any given point in time is insufficient to understand whether a free lunch policy is possible or not……We focus in particular on three factors that are relevant for the Goldilocks zone: aggregate demand (as captured by discount rates), trend growth rates, and inequality….”

Core point, "...we find that a government can sustain a large debt to GDP ratio in the Goldilocks zone, the maximum permanent deficit that can be sustained is in the range of 2%, which is lower than most projections of expected future deficits for the United States. Furthermore, the Goldilocks zone is fragile; a rise in aggregate demand, a decline in trend growth, or a decline in inequality can lead to a shrinkage, or even a vanishing, of the zone....”

  • Government Spending
  • Fiscal Policy
    • Fiscal Deficits
    • Taxation
  • GDP
    • Business Cycle
    • Inflation

Monday, June 7, 2021

Self-Driving Cars Could Be Decades Away, No Matter What Elon Musk Said

AI Summary. More than $80bn has been invested in autonomous driving, yet experts argue fully self-driving cars remain decades away because current machine-learning systems excel at pattern-matching but struggle with knowledge-based reasoning needed for unexpected road situations. Ultra-detailed maps are not updated often enough to cover cases like unmapped construction sites.

Christopher Mims Wall Street Journal
Date Posted:
June 7, 2021
Is Database:
Database

$80bn invested in autonomous driving tech, yet fully self-driving cars remain decades away due to significant AI challenges.

$80bn invested in autonomous driving tech, yet fully self-driving cars remain decades away due to significant AI challenges.

Why are fully self-driving cars still decades away despite massive investment?

Core argument: More than $80bn has been invested in autonomous driving technology, yet experts argue fully self-driving cars remain decades away because of unresolved AI challenges.

Despite over $80bn invested in autonomous driving technology, fully self-driving cars remain decades away due to significant AI challenges. Experts highlight that current machine-learning systems excel at pattern-matching but struggle with knowledge-based reasoning, crucial for navigating complex, real-world scenarios. Attempts to compensate with ultra-detailed maps are insufficient, as they aren't updated frequently enough to handle unexpected situations like unmapped construction sites. While small, low-speed shuttles in well-mapped areas may reduce uncertainty to acceptable levels, achieving widespread autonomy requires breakthroughs in AI or a complete redesign of urban infrastructure. Consequently, the promise of steering-wheel-free cars remains elusive, with current offerings limited to enhanced driver-assist systems. This underscores the gap between investment expectations and technological reality, suggesting that the path to full autonomy may involve integrating AI with other technologies and systems engineering approaches.

Takeaways by Macro Roundup® AI

  1. More than $80bn has been invested in autonomous driving technology, yet experts argue fully self-driving cars remain decades away because of unresolved AI challenges.
  2. Current machine-learning systems excel at pattern-matching but struggle with the knowledge-based reasoning needed for complex real-world driving, and ultra-detailed maps cannot compensate because they are not updated often enough to cover unmapped construction sites.
  3. Small, low-speed shuttles in well-mapped areas may reduce uncertainty to acceptable levels, but widespread autonomy would require breakthroughs in AI or a complete redesign of urban infrastructure, leaving current offerings limited to enhanced driver-assist systems.

State of play of autonomous driving technology"...In contrast to investors and CEOs, academics who study artificial intelligence, systems engineering and autonomous technologies have long said that creating a fully self-driving automobile would take many years, perhaps decades. Now some are going further, saying thatdespite investments already topping $80 billion, we may never get the self-driving cars we were promised. At least not without major breakthroughs in AI, which almost no one is predicting will arrive anytime soon—or a complete redesign of our cities. A recently published paper called “Why AI is Harder Than We Think” sums up the situation nicely. In it, Melanie Mitchell, a computer scientist and professor of complexity at the Santa Fe Institute, notes that as deadlines for the arrival of autonomous vehicles have slipped, people within the industry are redefining the term. To gauge today’s machine-learning systems, she developed a four-level scale of AI sophistication. The simplest kind of thinking starts with skill-based “bottom-up” reasoning. Today’s AIs are quite good at things like teaching themselves to stay within lines on a highway. The next step up is rule-based learning and reasoning (i.e., what to do at a stop sign). After that, there’s knowledge-based reasoning. (Is it still a stop sign if half of it is covered by a tree branch?) And at the top is expert reasoning: the uniquely human skill of being dropped into a completely novel scenario and applying our knowledge, experience and skills to get out in one piece. Problems with driverless cars really materialize at that third level. Today’s deep-learning algorithms, the elite of the machine-learning variety, aren’t able to achieve knowledge-based representation of the world, says Dr. Cummings. And human engineers’ attempts to make up for this shortcoming—such as creating ultra-detailed maps to fill in blanks in sensor data—tend not to be updated frequently enough to guide a vehicle in every possible situation, such as encountering an unmapped construction site. Machine-learning systems, which are excellent at pattern-matching, are terrible at extrapolation—transferring what they have learned from one domain into another. For example, they can identify a snowman on the side of the road as a potential pedestrian, but can’t tell that it’s actually an inanimate object that’s highly unlikely to cross the road. Small, low-speed shuttles working in well-mapped areas, bristling with sensors such as lidar, could allow engineers to get the amount of uncertainty down to a level that regulators and the public would find acceptable. (Picture shuttles to and from the airport, driving along specially constructed lanes, for example.)

Christopher Mims, "Self-Driving Cars Could Be Decades Away, No Matter What Elon Musk Said,"Wall Street Journal, June 5, 2021, https://www.wsj.com/articles/self-driving-cars-could-be-decades-away-no-matter-what-elon-musk-said-11622865615

Self-Driving Cars Could Be Decades Away, No Matter What Elon Musk Said

In 2015, Elon Musk said self-driving cars that could drive “anywhere” would be here within two or three years.

In 2016, Lyft CEO John Zimmer predicted they would “all but end” car ownership by 2025.

In 2018, Waymo CEO John Krafcik warned autonomous robocars would take longer than expected.

In 2021, some experts aren’t sure when, if ever, individuals will be able to purchase steering-wheel-free cars that drive themselves off the lot.

In contrast to investors and CEOs, academics who study artificial intelligence, systems engineering and autonomous technologies have long said that creating a fully self-driving automobile would takemany years, perhaps decades. Now some are going further, saying that despiteinvestments already topping $80 billion, we may never get the self-driving cars we were promised. At least not without major breakthroughs in AI, which almost no one is predicting will arrive anytime soon—or a complete redesign of our cities.

Even those who have hyped this technology most—in 2019 Mr. Musk doubled down on previous predictions, and said that autonomous Tesla robotaxiswould debut by 2020—are beginning to admit publicly that naysaying experts may have a point.

“A major part of real-world AI has to be solved to make unsupervised, generalized full self-driving work,” Mr. Musk himselfrecently tweeted. Translation: For a car to drive like a human, researchers have to create AI on par with one. Researchers and academics in the field will tell you that’s something we haven’t got a clue how to do. Mr. Musk, on the other hand, seems to believe that’s exactly what Tesla will accomplish. Hecontinually hypesthe next generation of the company’s “Full Self Driving” technology—actually a driver-assist system with a misleading name—which is currently in beta testing.

A recently published paper called “Why AI is Harder Than We Think” sums up the situation nicely. In it, Melanie Mitchell, a computer scientist and professor of complexity at the Santa Fe Institute, notes that as deadlines for the arrival of autonomous vehicles have slipped, people within the industry are redefining the term. Since these vehicles require a geographically constrained test area and ideal weather conditions—not to mention safety drivers or at least remote monitors—makers and supporters of these vehicles have incorporated all of those caveats into their definition of autonomy.

Even with all those asterisks, Dr. Mitchell writes, “none of these predictions has come true.”

In vehicles you can actually buy, autonomous driving has failed to manifest as anything more than enhanced cruise control, like GM’s Super Cruise or the optimistically named Tesla Autopilot. In San Francisco, GM subsidiary Cruise is testing autonomous vehicles with no driver behind the wheel but a human monitoring the vehicle’s performance from the back seat. And there’s only one commercial robotaxi service operating in the U.S. with no human drivers at all, a small-scale operation limited to low-density parts of the Phoenix metro area, from Alphabet subsidiary Waymo.

Even so, Waymo vehicles have been involved in minor accidents in which they were rear-ended, and their confusing (to humans) behavior was cited as a possible cause. Recently, one was confused by traffic cones at a construction site.

“I am not aware we are struck or rear-ended any more than a human driver,” says Nathaniel Fairfield, a software engineer and head of the “behavior” team at Waymo. The company’s self-driving vehicles have been programmed to be cautious—“the opposite of the canonical teenage driver,” he adds.

Chris Urmson is head of autonomous trucking startup Aurora, which recently acquired Uber’s self-driving division. (Uber also invested $400 million in Aurora.) “We’re going to see self-driving vehicles on the road doing useful things in the next couple of years, but for it to become ubiquitous will take time,” he says.

Key to Aurora’s initial rollout will be that it will only operate on highways where the company has already created a high-resolution, three-dimensional map, says Mr. Urmson. Aurora’s eventual goal is for both trucks and cars using its systems to travel farther from the highways where it will at first be rolled out, but Mr. Urmson declined to say when that might happen.

The slow rollout of limited andconstantly human-monitored“autonomous” vehicles was predictable, andeven predicted, years ago. But some CEOs and engineers argued that new self-driving capabilities would emerge if these systems could just log enough miles on roads. Now, some are taking the position that all the test data in the world can’t make up for AI’s fundamental shortcomings.

Decades of breakthroughs in the part of artificial intelligence known as machine learning have yielded only the most primitive forms of “intelligence,” says Mary Cummings, a professor of computer science and director of the Humans and Autonomy Lab at Duke University, who has advised the Department of Defense on AI.

To gauge today’s machine-learning systems, she developed afour-level scaleof AI sophistication. The simplest kind of thinking starts with skill-based “bottom-up” reasoning. Today’s AIs are quite good at things like teaching themselves to stay within lines on a highway. The next step up is rule-based learning and reasoning (i.e., what to do at a stop sign). After that, there’s knowledge-based reasoning. (Is it still a stop sign if half of it is covered by a tree branch?) And at the top is expert reasoning: the uniquely human skill of being dropped into a completely novel scenario and applying our knowledge, experience and skills to get out in one piece.

Problems with driverless cars really materialize at that third level. Today’s deep-learning algorithms, the elite of the machine-learning variety, aren’t able to achieveknowledge-based representationof the world, says Dr. Cummings. And human engineers’ attempts to make up for this shortcoming—such as creatingultra-detailed mapsto fill in blanks in sensor data—tend not to be updated frequently enough to guide a vehicle in every possible situation, such as encountering an unmapped construction site.

Machine-learning systems, which are excellent at pattern-matching, areterrible at extrapolation—transferring what they have learned from one domain into another. For example, they can identify a snowman on the side of the road as a potential pedestrian, but can’t tell that it’s actually an inanimate object that’shighly unlikely to cross the road.

“When you’re a toddler, you’re taught the hot stove is hot,” says Dr. Cummings. But AI isn’t great at transferring the knowledge of one stove to another stove, she adds. “You have to teach that for every single stove that’s in existence.”

Some researchers at MIT are trying to fill this gap by going back to basics. They have launched ahuge effortto understand how babies learn, in engineering terms, in order to translate that back to future AI systems.

“Billions of dollars have been spent in the self-driving industry and they are not going to get what they thought they were going to get,” says Dr. Cummings. This doesn’t mean we won’t eventually get some form of “self-driving” car, she says. It just “won’t be what everybody promised.”

But, she adds, small, low-speed shuttlesworking in well-mapped areas, bristling with sensors such as lidar, could allow engineers to get the amount of uncertainty down to a level that regulators and the public would find acceptable. (Picture shuttles to and from the airport, driving along specially constructed lanes, for example.)

Mr. Fairfield of Waymo says his team sees no fundamental technological barriers to making self-driving robotaxi services like his company’s widespread. “If you’re overly conservative and you ignore reality, you say it’s going to take 30 years—but it’s just not,” he adds.

A growing number of experts suggest that the path to full autonomy isn’t primarily AI-based after all. Engineers have solved countless other complicated problems—including landing spacecraft on Mars—by dividing the problem into small chunks, so that clever humans can craft systems to handle each part. Raj Rajkumar, a professor of engineering at Carnegie Mellon University with a long history of working on self-driving cars, is optimistic about this path. “It’s not going to happen overnight, but I can see the light at the end of the tunnel,” he says.

This is the primary strategy Waymo has pursued to get its autonomous shuttles on the road, and as a result, “we don’t think that you need full AI to solve the driving problem,” says Mr. Fairfield.

Mr. Urmson of Aurora says that his company combines AI with other technologies to come up with systems that can apply general rules to novel situations, as a human would.

Getting to autonomous vehicles the old-fashioned way, withtried-and-true“systems engineering,” would still mean spending huge sums outfitting our roads with transponders and sensors to guide and correct the robot cars, says Dr. Mitchell. And they would remain limited to certain areas, and certain weather conditions—with human teleoperators on standby should things go wrong, she adds.

This Disney animatronic version of our self-driving future would be a far cry from creating artificial intelligence that could simply be dropped into any vehicle, immediately replacing a human driver. It could meansafer human-driven cars, and fully autonomous vehicles in a handful of carefully monitored areas. But it would not be the end of car ownership—not anytime soon.

  • Productivity
    • Innovation/Research
    • Investment

Why is Productivity slowing down?

AI Summary. Researchers attribute 44% of the labor productivity slowdown in advanced economies to reduced capital deepening, with slower total factor productivity growth linked to less intangible asset accumulation and lower allocative efficiency. Labor productivity growth has fallen from about 2% to under 1%, with manufacturing the most affected sector.

Ian Goldin Stanford University
Date Posted:
June 7, 2021
Is Database:
Database

Capital deepening accounts for 44% of the slowdown in labor productivity, while TFP slowdown explains the residual.

What explains the labor productivity slowdown in advanced economies?

Core argument: Reduced capital deepening accounts for 44% of the labor productivity slowdown in advanced economies, particularly the US, driven by cyclical factors such as financial constraints and weak post-financial-crisis demand alongside structural shifts toward intangible investment and globalization.

The slowdown in labor productivity in advanced economies, particularly in the US, is primarily attributed to a reduction in capital deepening, which accounts for 44% of the decline. This reduction is driven by both cyclical factors, such as financial constraints and weak demand post-financial crisis, and structural changes like the rise of intangible investments and globalization. Additionally, the slowdown in Total Factor Productivity (TFP) is linked to decreased intangible asset accumulation and lower allocative efficiency. Despite technological advancements, labor productivity growth has fallen from ~2% to less than 1% post-2005, with manufacturing being the most affected sector. The interplay of these factors highlights the complexity of the productivity slowdown, with no single cause fully explaining the trend.

Takeaways by Macro Roundup® AI

  1. Reduced capital deepening accounts for 44% of the labor productivity slowdown in advanced economies, particularly the US, driven by cyclical factors such as financial constraints and weak post-financial-crisis demand alongside structural shifts toward intangible investment and globalization.
  2. Labor productivity growth in advanced economies has fallen from roughly 2% to less than 1% after 2005 despite technological advances, with manufacturing the most affected sector.
  3. The slowdown in Total Factor Productivity is linked to decreased intangible asset accumulation and lower allocative efficiency, with no single cause fully explaining the productivity trend.

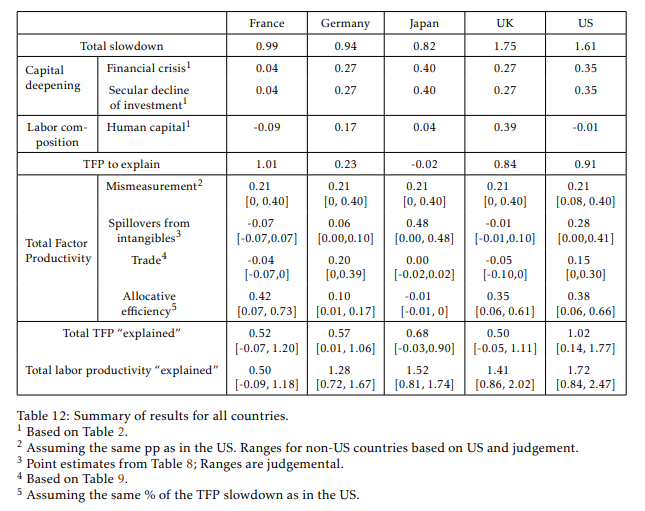
Ian Goldin, Pantelis Koutroumpis, François Lafond and Julian Winkler, "Why is Productivity slowing down?" Oxford University, May 9, 2021, https://www.oxfordmartin.ox.ac.uk/downloads/academic/ProductivitySlowdown.pdf

Why is Productivity slowing down?: Extended Excerpt Image 1


Capital deepening evidence

Their takeaways, “….Comparing the period after 2005 to the 1995-2005 decade, there is a generalised slowdown in productivity in advanced economies, with labor productivity growth falling from around 2% to less than 1%. While part of this decline may be due the end of convergence and a return to “normal” rates of growth at the frontier, it remains puzzling in view of its scale, and considering the context of continued deployment of new digital and other technologies. The literature points to wide and varied reasons, which our review has sought to systematically evaluate. We identified a small set of forces and mechanisms that taken together explain most of the slowdown. Table 11 summarizes the results, although it is limited to the explanations that we have evaluated quantitatively Accelerated mismeasurement, which is mostly due the inherent difficulty of measuring aggregate price changes when creative destruction and quality change are important, contributed less than 15% of the slowdown in the US, although there are large uncertainties associated with this estimate. The reduction in the contribution of capital deepening contributed almost 45% of the slow down in the US.We did not evaluate the relative contributions of specific underlying causes quantitatively, but, considering the literature on the slowdown of investment, we make a rough estimate that the two categories of factors contributed about equally. The first set of factors, which we call Financial Crisis, includes weak demand and credit constraints during, and to some extent in and after the financial crisis. The second set of factors, which we group under the name “secular decline of investment”, recognizes that investment may have been weak due to more structural changes, such as the increasing share of intangibles and globalization, with additional hypotheses including changes to corporate governance, and the weakening of competition. There is also a recognition that intangible investment, due to its higher potential for spillovers, may affect labor productivity through TFP, that is, above and beyond its impact through capital deepening. Reusing published elasticities, we find that the slowdown in intangible assets accumulation may have had a substantial effect on the TFP slowdown. Conventional growth accounting finds almost no role for a decline of human capital accumulation in the US, and a weak role at best elsewhere. But several labor-related mechanisms may have affected TFP, including aging and labor market institutions A key feature of the last two decades is the fast growth of global trade after 1995, and its collapse during the financial crisis. Any positive effect of trade would therefore translate into a productivity slowdown, and we do indeed find substantial effects. A large part of the current discussion on the productivity slowdown centers on business dynamism and competition, documenting trends such as declining entry-exit, increasing markups and concentration, an increasing divergence of the most productive firms. There is no consensus in the literature as to whether these trends are intrinsically good or bad for productivity and welfare, as concentration can reflect output-restricting dominant positions or a better allocation of resources to highly productive firms in an economy where firms are increasingly operating under increasing returns to scale, due in particular to the increasing prevalence of intangible investment. We do not attempt to settle this debate, but to reflect the potential importance of these trends we use recently developed estimates of the contribution of allocative efficiency to TFP growth that are calibrated on firm-level markup time series. We find that increasing allocative efficiency was a stronger contributor to TFP growth in the decade prior to 2006, implying that the lower contribution of increasing allocative efficiency to TFP growth is a substantial contribution to the TFP slowdown…”

6) Tech change

5) Dynamism, rise in market power

4) Impact of trade, this is basically the China Shock as supply chains have shifted away from higher income countries

3) Human capital, changes in populations demographics, included educational and skill levels

2) Lower rate of capital deepening per workers, they look at two effects a cyclical driver related to the crisis (so lower AD, credit constraints) and secular factors that are independent of business cycle (so the rise of intangibles, and a continued shift to foreign investments over domestic investment

1) Output is increasingly mismeasured. “…Mismeasurement of labor productivity can be due to three main sources: a mismeasurement of nominal output (perhaps due to changing boundaries of GDP), a mismeasurement of deflators, which has received the most attention in the literature, and a mismeasurement of labor inputs….potential biases in deflators. The main sources of bias include: issues with sampling and measuring prices and relative weights of items in consumption (or other final demand) baskets; issues with aggregating low-level price changes into indices, in view of the difficulty of assessing whether the shares of each item in the baskets are changing because of substitution induced by changes to relative prices; issues with the addition of new products and removal of disappearing products; issues with assessing quality change; more broadly, issues with new forms of commercialization (i.e. new retail outlets)….”

They offer a useful list of theories for the slowdown, though none that we are unfamiliar with:

In terms of TFP they largely cite some of Baqaee & Farhi work that decompose TFP into an “allocative efficiency” and a technology component, where allocative efficiency is ~ markups“…They find that allocative efficiency contributed around half of TFP growth between 1997 and 2014;we compute that it also contributed to roughly half of its slowdown between 1997-2005 and 2006-2014….”

Impact of capital deepening, “…We find that a decline in the rate of capital deepening has contributed to the slowdown, mostly driven by non-ICT physical capital, but also ICT capital and Intangibles. We distinguish two core arguments to explain this phenomenon. The first relates to the financial crisis, and suggests that the decline in investment is a cyclical phenomenon driven by financial constraints and weak aggregate demand. A second candidate explanation recognizes that the slowdown started before the crisis, so that structural factors may have been more important, including primarily a change in the composition of capital towards intangibles (which are riskier), but also lower competition, increasing short-termism, and the off-shoring of physical investment in the context of increasingly global value chains. We are unable to derive relative contributions for all of these factors, but as a whole we estimate that capital deepening explains 44% of the labor productivity slowdown in the US. In addition to this, we report evidence of the slowdown in intangible capital services, which it is argued to contribute to lower TFP growth…”

Trends in US and comps, “.. First, there was no convergence in the 1995-2005 decade, so slower convergence cannot explain the slower rates in Europe after 2005 compared to 1995-2005. Second, while it is true that the frontier (US) may be returning to more “normal” rates of growth after the 1995-2005 IT boom, the rates of labor productivity growth in all countries are still broadly speaking lower than at any time in the 20th century, and are low in all the 5 countries we study at the same time. Thus, while we see part of slowdown as simply reflecting the fact that all 5 advanced economies are now more or less frontier economies progressing at a “normal” rate, the rates observed are very low by historical standards and appear surprising in a context of technological transformations. That said, throughout the paper, we examine the role of both secular trends, such as aging and structural change, and cyclical or market phenomena, such as declines in investment…”

Note the paper is largely a lit review

Though you would want to see a more detailed writeup of the Oxford paper that was included in the morning roundup, on the slowdown of labor productivity and makes an effort to break down drivers for the US and some comps (France, Germany, Japan, UK), “….Comparing the post-2005 period with the preceding decade for 5 advanced economies, we seek to explain a slowdown of 0.8 to 1.8pp. We trace most of this to lower contributions of TFP and capital deepening, with manufacturing accounting for the biggest sectoral share of the slowdown. No single explanation accounts for the slowdown, but we have identified a combination of factors which taken together account for much of what has been observed….”

Ed Comment:Ben would need to explain this to us for me to feel confident in my understanding. My own view is that, aside from the financial crisis, there are no constraints and savings and investment. So the slowdown is entirely structural. I believe (in approximate order of importance) and off the top of my head:

  • The 1940s to 60s were uniquely productive and therefore a misleading standard of comparison
    • And they started for a low base.
  • Manufacturing productivity gains have exceeded the growth in the demand for manufactured goods, hollowing out manufacturing employment.
  • $3 an hour offshore labor has exacerbated the demise of manufacturing.
  • Services have inherently slower productivity growth for a variety of known and unknown reasons.
    • There are less economies of scale.
    • The operations are more decentralized than manufacturing and therefore harder to manage.
    • The tasks are less specialized.
    • There are no machines to pace the work.
    • The need for more human interaction makes the tasks harder.
  • Talented people are increasing working for each other.
    • It’s more profitable/rewarding
    • Hard-to-manage low-skilled services exacerbates the tradeoff.
  • Workers who can’t supervise themselves are increasingly pushed into jobs suffering from Baumol’ cost disease.
  • There is no reason why the value per capita produced by (a fixed number of ) innovators (per capita) should be growing at the same proportional amount to GDP per capita. I suspect it should be declining all other things being equal. A person can only do/create so much. And economy that twice as large per capita doesn’t make innovators twice as productive.
  • Larger world markets make improvements more profitable, so effort can be profitably diverted to smaller improvements.
  • Talent is constrained.
    • Innovation requires more than just scientific researchers. Talent added to one task in the chain of tasks, reduces talent in the other tasks in the chain.
    • The share of talented people willing to get trained and serve customers has largely been maxed out.
    • The richer we get the more it costs to get people to do it.
    • The lib-tard brainwash people into not doing it.
  • Education isn’t very effective, at least as it is currently administered.
  • We are in a j-curve lull in the exogenously give set of unfilled niches. AI, quantum computing, fusion, and cancer cures have all proven harder than expected.
  • Healthcare innovation reduces productivity by extending lives unproductivity.
  • Inflation is mismeasured (for political reasons).
  • To a lesser extent, so is the value of innovation.
  • Government, regulation, and redistribution are growing and slow productivity growth.
  • So do environmental and other similar concerns chiefly demands for diversity with double standards over meritocracy.
  • The Mideast wars were more expensive than people realize.
  • The share of dumb people is growing faster than smart people.
  • and 1995 to 2005 was a blimp up in the US because of the success we enjoyed creating the first wave of commercializing the internet and using the information to make decisions more effectively. (i.e., we are now in the lull of the j-curve).

  • Productivity
    • Incentives/Risk-Taking
    • Innovation/Research
    • Institutional Capabilities
    • Investment
  • GDP
    • Growth


Loading More Posts

End of content

No more pages to load

© Copyright 2026 Coherent Research Institute · All Rights Reserved · Privacy · Terms