Edward Conard

Top Ten New York Times Bestselling Author

  • “…a must-read for serious students of economic policy.” - Glenn Hubbard, Dean, Columbia Business School, and former Chairman of the Council of Economic Advisers
  • “…a fresh argument for the productive value of inequality.” - David Autor, Professor of Economics, Massachusetts Institute of Technology
  • “…a comprehensive explanation of the modern economy.” - Julian Robertson, Founder, Tiger Management
  • “Unintended Consequences offers deep and well-argued analyses on almost every issue.” - The New York Times
  • “…challenges misconceptions that distort our economic debates.” - Arthur Brooks, President of the American Enterprise Institute
  • “Unintended Consequences is far smarter and more thought-provoking than most economics written for the general public” - Greg Mankiw, Harvard University, Former Chairman of the Council of Economic Advisors
  • “…serious thinking for serious thinkers. …a thought-provoking blueprint for growing middle- and working-class incomes.” - Mitt Romney, former Governor of Massachusetts
  • “…challenges misconceptions that distort our economic debates.” - Arthur Brooks, President of the American Enterprise Institute
  • “…a fresh argument for the productive value of inequality.” - David Autor, Professor of Economics, Massachusetts Institute of Technology
  • “A full-throated defense of economic dynamism.” - The Wall Street Journal
  • “…serious thinking for serious thinkers. …a thought-provoking blueprint for growing middle- and working-class incomes.” - Mitt Romney, former Governor of Massachusetts
  • “…a very valuable contribution.” - Larry Summers, former Secretary of the Treasury and director of the National Economic Council, president emeritus, Harvard University
Upside of Inequality Oxford Unintended Consequences
Buy the Books
  • Macro Roundup
  • About Roundup
  • About Ed Conard
  • Highlights
  • Topics
  • Subscribe
Edward Conard
  • twitter
  • facebook
  • linkedin
  • youtube

Macro Roundup

  • Email
  • Text Message (SMS)
  • Twitter/X
  • LinkedIn
  • Facebook
  • WhatsApp Message
Subscribe to Macro Roundup Emails
Select topics to choose: articles that mention them (broader) or articles mainly about them (focused)
  • Mentions 0
  • Primary focus 0
Showing all 7,294 Macro Roundup articles
When you search for any topic (like GDP, Inflation, or Banking), choose:
Choose search scope

Wednesday, March 3, 2021

Animated chart of the day: Female share of US bachelors degrees, 1971 to 2019

AI Summary. The female share of US bachelor's degrees across 16 academic fields has been largely stable since 2000, with exceptions including architecture, where the female share rose from 37.6% to 48.1%, and computer science, where it fell from 28.1% to 20.6%.

Mark Perry American Enterprise Institute
Date Posted:
March 3, 2021
Is Database:
Database

The female share of bachelor’s degrees across 16 academic fields has shown remarkable stability since 2000, indicating a stabilization of long-term trends.

Has the female share of US college degrees stabilized by field?

Core argument: The female share of US bachelor's degrees across 16 academic fields has been largely stable since 2000, based on data spanning 1971 to 2019.

The female share of bachelor's degrees across 16 academic fields has shown remarkable stability since 2000, indicating a stabilization of long-term trends. Notable exceptions include an increase in the female share of Architecture degrees from 37.6% in 2000 to 48.1% in 2019 and a decrease in Computer Science from 28.1% to 20.6% over the same period. This stability suggests that gender differences in academic interests and abilities have led to consistent self-selection into different college majors. The lack of significant changes over the past two decades highlights a persistent gender-based preference in academic fields, reflecting broader societal trends in education and labor market participation.

Takeaways by Macro Roundup® AI

  1. The female share of US bachelor's degrees across 16 academic fields has been largely stable since 2000, based on data spanning 1971 to 2019.
  2. Architecture was an exception, with the female share of bachelor's degrees rising from 37.6% in 2000 to 48.1% in 2019.
  3. The female share of Computer Science bachelor's degrees fell from 28.1% in 2000 to 20.6% in 2019.

Mark Perry chart suggested revealed preference by gender in terms of academic interest, "What’s also especially noteworthy about the visualization is the remarkable stability in the female share of degrees in almost all of 16 academic fields over the last 20 years, a period when the long-term trends seem to have stabilized. The only two exceptions to the stabilization of the female share of degrees since the turn of the century are the increase in the female share of Architecture degrees from 37.6% in 2000 to 48.1% in 2019 and the decrease in the female share of Computer Science degrees from 28.1% in 2000 to 20.6% in 2019. But follow the bars for any of the other 14 college majors over the last several decades and you’ll see that there is very little variation in the female share of bachelor’s degrees from 2000-2019.What makes most “bar chart race” visualizations interesting is to watch important and significant changes over time in the variables. What I think makes this “bar chart race” so interesting is to watch the lack of significant changes over time, especially the last 20 years!Bottom Line: Who’d a-thunk it? It’s almost as if men and women have different academic interests and abilities, and those gender differences are reflected in relatively stable self-selections of different college majors, especially over the most recent 20 years...."

Animated chart of the day: Female share of US bachelors degrees, 1971 to 2019: Extended Excerpt Image 1


Mark Perry, "Animated chart of the day: Female share of US bachelor’s degrees, 1971 to 2019," American Enterprise Institute, March 1, 2021, https://www.aei.org/carpe-diem/animated-chart-of-the-day-female-share-of-us-bachelors-degrees-1971-to-2019/

  • College
  • Comparisons
    • Gender
    • Historical
  • Workforce
    • Education

Thursday, March 4, 2021

The Budget And Economic Outlook: 2014 to 2024

AI Summary. The Congressional Budget Office projects the Affordable Care Act will reduce full-time-equivalent employment by about 2.5m, cutting total hours worked by 1.5% to 2.0% and aggregate labor compensation by about 1%, with larger effects among lower-wage workers. The projected decline reflects workers choosing to supply less labor in response to new taxes and benefits, not higher unemployment.

CBO Staff Congressional Budget Office
Date Posted:
March 4, 2021
Is Database:
Database

The Congressional Budget Office (CBO) projects that the Affordable Care Act (ACA) will lead to a reduction in full-time-equivalent employment by approximately 2.5m by 2024, compared to what would have occurred without the ACA.

The Congressional Budget Office (CBO) projects that the Affordable Care Act (ACA) will lead to a reduction in...

Does health insurance reform reduce how much workers choose to work?

Core argument: CBO projects the Affordable Care Act will reduce full-time-equivalent employment by roughly 2.5m by 2024 relative to what would have occurred without the law, primarily through lower labor supply as workers choose fewer hours or none.

The Congressional Budget Office (CBO) projects that the Affordable Care Act (ACA) will lead to a reduction in full-time-equivalent employment by approximately 2.5m by 2024, compared to what would have occurred without the ACA. This decline is primarily due to a decrease in labor supply, as workers opt to work fewer hours or not at all, influenced by new taxes, incentives, and financial benefits. The CBO estimates a 1.5% to 2.0% reduction in total hours worked from 2017 to 2024, with a corresponding 1% decrease in aggregate labor compensation. The impact is expected to be more pronounced among lower-wage workers, though the overall economic effect will be smaller than the reduction in hours worked. This change reflects a shift in labor force participation rather than an increase in unemployment or underemployment.

Takeaways by Macro Roundup® AI

  1. CBO projects the Affordable Care Act will reduce full-time-equivalent employment by roughly 2.5m by 2024 relative to what would have occurred without the law, primarily through lower labor supply as workers choose fewer hours or none.
  2. CBO estimates the ACA will cut total hours worked by 1.5% to 2.0% from 2017 to 2024, with aggregate labor compensation falling about 1%, a smaller effect than the reduction in hours.
  3. CBO attributes the labor-supply decline to new taxes, incentives, and financial benefits, with effects more pronounced among lower-wage workers and reflecting reduced labor force participation rather than higher unemployment or underemployment.

CBO 2014 Budget and Economic Outlook has a section (Appendix C) on the Labor Market Effects of the Affordable Care Act. Suspect this is the report you are recalling as it was published in February 2014. However I’m not seeing specific estimates on the employment impact by skill level, going though the footnotes now.

“…CBO estimates that the ACA will reduce the total number of hours worked, on net, by about 1.5 percent to 2.0 percent during the period from 2017 to 2024, almost entirely because workers will choose to supply less labor—given the new taxes and other incentives they will face and the financial benefits some will receive. Because the largest declines in labor supply will probably occur among lower-wage workers, the reduction in aggregate compensation (wages, salaries, and fringe benefits) and the impact on the overall economy will be proportionally smaller than the reduction in hours worked. Specifically, CBO estimates that the ACA will cause a reduction of roughly 1 percent in aggregate labor compensation over the 2017-2024 period, compared with what it would have been otherwise. Although such effects are likely to continue after 2024 (the end of the current 10-year budget window), CBO has not estimated their magnitude or duration over a longer period. The reduction in CBO’s projections of hours worked represents a decline in the number of full-time-equivalent workers of about 2.0 million in 2017, rising to about 2.5 million in 2024. Although CBO projects that total employment (and compensation) will increase over the coming decade, that increase will be smaller than it would have been in the absence of the ACA.The decline in fulltime-equivalent employment stemming from the ACA will consist of some people not being employed at all and other people working fewer hours; however, CBO has not tried to quantify those two components of the overall effect.The estimated reduction stems almost entirely from a net decline in the amount of labor that workers choose to supply, rather than from a net drop in businesses’ demand for labor, so it will appear almost entirely as a reduction in labor force participation and in hours worked relative to what would have occurred otherwise rather than as an increase in unemployment (that is, more workers seeking but not finding jobs) or underemployment (such as part-time workers who would prefer to work more hours per week)….”

CBO Staff, “The Budget And Economic Outlook: 2014 to 2024,” Congressional Budget Office, February 7, 2014, https://www.cbo.gov/sites/default/files/113th-congress-2013-2014/reports/45010-outlook2014feb0.pdf

“….CBO’s updated estimate of the decrease in hours worked translates to a reduction in full-time-equivalent employment of about 2.0 million in 2017,rising to about 2.5 million in 2024, compared with what would have occurred in the absence of the ACA.Previously, the agency estimated that if the ACA did not affect the average number of hours worked per employed person, it would reduce household employment in 2021 by about 800,000.25 By way of comparison, CBO’s current estimate for 2021 is a reduction in full-time-equivalent employment of about 2.3 million…”

  • Minimum Wage
  • Workforce
    • Unemployment/Participation

The Effects Of A Minimum Wage Increase On Employment And Family Income

AI Summary. The Congressional Budget Office estimates that a $15 minimum wage would leave 1.3m workers jobless who would otherwise be employed — 0.8% of all workers and 7% of those directly affected — with teenagers and part-time workers most affected. Marginal workers' employment opportunities fall at three times the rate for adults generally.

CBO Staff Congressional Budget Office
Date Posted:
March 4, 2021
Is Database:
Database

CBO report highlights that increasing the minimum wage disproportionately impacts marginal workers, reducing their employment opportunities at a rate 3x higher than for adults generally.

Does a higher minimum wage reduce employment most for marginal workers?

Core argument: Under a $15 minimum wage, CBO estimates 1.3m workers who would otherwise be employed would become jobless, equal to 0.8% of all workers and 7% of those directly affected, with teenagers and part-time workers most affected.

The CBO report highlights that increasing the minimum wage disproportionately impacts marginal workers, reducing their employment opportunities at a rate three times higher than for adults generally. This is particularly concerning for groups like African-American workers aged 20-24, where unemployment already stands at 23%. Raising the minimum wage to $10.10 per hour exacerbates the challenge for low-skilled workers who struggle to produce the value required by employers, making it harder for them to secure entry-level jobs that are crucial for long-term employment. Additionally, under a $15 minimum wage scenario, 1.3m workers who would otherwise be employed could become jobless, with teenagers and part-time workers being most affected. This represents 0.8% of all workers and 7% of those directly affected, indicating significant employment shifts within vulnerable demographics.

Takeaways by Macro Roundup® AI

  1. Under a $15 minimum wage, CBO estimates 1.3m workers who would otherwise be employed would become jobless, equal to 0.8% of all workers and 7% of those directly affected, with teenagers and part-time workers most affected.
  2. The CBO report finds minimum wage increases reduce employment opportunities for marginal workers at three times the rate for adults generally, a concern for groups such as African-American workers aged 20–24, whose unemployment stands at 23%.
  3. Raising the minimum wage to $10.10 per hour makes it harder for low-skilled workers who struggle to produce the value employers require to secure entry-level jobs that matter for long-term employment.

CBO Staff, “The Effects Of A Minimum Wage Increase On Employment And Family Income,” Congressional Budget Office, February 2014, https://www.cbo.gov/sites/default/files/cbofiles/attachments/44995-MinimumWage.pdf

You did write twoblogpostson it at the time reporting on their estimates of employment impacts (this language is from the second one) on marginal workers, “…The most damning aspect is the report’s implicit acknowledgment that raising the minimum wage hurts marginal workers by reducing their chances for employment. The report estimates that raising the minimum wage will imposed three times as many job losses on marginal workers as adults generally. Nevertheless, the report concludes that overall job losses suffered by marginal workers are likely to be low because few marginal workers currently have jobs. Twenty-three percent of African-American workers between the ages of 20 and 24 years old, for example, are unemployed. For the least skilled among those workers, the unemployment rate is even higher. Those workers are unable to produce $7.25 of value in an hour of work—the amount of the minimum wage—that customers are willing to buy, and so remain unemployed. Raising the minimum wage to $10.10 per hour will make it that much harder for those workers to find economically viable work. So in addition to the 500,000 workers who can produce $7.25 of value in an hour but not $10.10—individuals who the CBO expects will lose their jobs outright—there are many currently unemployed workers who will find it even harder to find work, especially low-skilled entry-level work that serves as a gateway to a lifetime of employment….”

So I looked at the2014 CBOreport on “The Effects of A Minimum-Wage Increase On Employment And Family Income” we had read.

Ed Comment, “This seems like it. seems I have somewhat misremembered it. this raises an interesting point about worker who don’t have jobs so wont lose their job but they wont get a job in the future. Does the new cbo report speak to this issue? My guess is lots of them don’t have jobs now too.”

Steve Comment, “So they don’t carve out a specific estimate of non-workers who would otherwise be working but for the higher wage specifically. “…Under the first option ($15 an hour), according to CBO’s median estimate, about 1.3 million workerswho would otherwise be employed would be joblessin an average week in 2025. That decrease would account for 0.8 percent of all workers and 7 percent of directly affected workers who would otherwise earn less than $15 per hour…The $15 option would alter employment more for some groups than for others. Almost 50 percent of the newly jobless workers in a given week—600,000 of 1.3 million—would be teenagers (some of whom would live in families with income well above the poverty threshold). Employment would also fall disproportionately among part-time workers and adults without a high school diploma….”In the appendix they define affected workers, this definition doesn’t seem to capture those who don’t gain entry into the labor force in the first place, though perhaps the “newly jobless workers” # above given teenagers are new labor market entries might be a proxy?“…For each option, CBO estimated the number of workers whocould be affected. Directly affected workers are those whose hourly wage, in the absence of the change in the minimum wage, would range from just below the old minimum to the new, higher minimum and who therefore would either receive a higher wage or become jobless if the new federal minimum were adopted. Potentially affected workers are those whose wages would otherwise be slightly above the new federal minimum in 2025; their wages would also be affected by a higher minimum.CBO projects that such workers’ employment would not be affected by their newly higher wages, though it might be affected by changes in overall demand induced by the options….”

  • Minimum Wage
  • Workforce
    • Unemployment/Participation

The Effect of Compulsory Schooling on Skills: Evidence from a Reform in Germany

AI Summary. The authors estimate that a German reform adding a ninth grade raised numeracy skills for basic-track students by 0.2 standard deviations, equivalent to an 8–9 percentage point gain in rank within the numeracy skill distribution. Estimated effects on literacy were not statistically precise.

Franziska Hampf Working Paper
Date Posted:
March 4, 2021
Is Database:
Database

Germany’s compulsory schooling reform added a 9th grade, increasing numeracy skills by 0.2 standard deviations for basic-track students, but had no impact on literacy skills.

Does an extra year of compulsory schooling raise numeracy skills?

Core argument: Germany's compulsory schooling reform, which added a ninth grade, raised numeracy skills of basic-track students by 0.2 standard deviations, equivalent to an 8–9 percentage point gain in rank within the numeracy skill distribution.

The German compulsory schooling reform, which added an additional ninth grade, resulted in a 0.2 standard deviation increase in numeracy skills for basic-track students, equating to a rise of 8-9 percentage points in their rank within the numeracy skill distribution. This reform, analyzed through a natural experiment using PIAAC data, highlights the long-term benefits of extended schooling on labor-market relevant cognitive skills. However, the reform had no significant impact on literacy skills, as the estimated effects were not statistically precise. The findings suggest that while increased schooling can enhance numeracy, literacy skills may require different educational strategies. The study underscores the importance of resource allocation and curriculum design in maximizing the effectiveness of educational reforms.

Takeaways by Macro Roundup® AI

  1. Germany's compulsory schooling reform, which added a ninth grade, raised numeracy skills of basic-track students by 0.2 standard deviations, equivalent to an 8–9 percentage point gain in rank within the numeracy skill distribution.
  2. The reform showed no significant effect on literacy skills, with estimated effects not statistically precise, in a natural-experiment analysis using PIAAC data.
  3. The study argues that extended schooling yields long-term gains in labor-market relevant cognitive skills and that resource allocation and curriculum design shape the effectiveness of educational reforms.

Franziska Hampf, "The Effect of Compulsory Schooling on Skills: Evidence from a Reform in Germany," ifo Working Paper, 2019, https://www.ifo.de/en/publikationen/2019/working-paper/effect-compulsory-schooling-skills-evidence-reform-germany

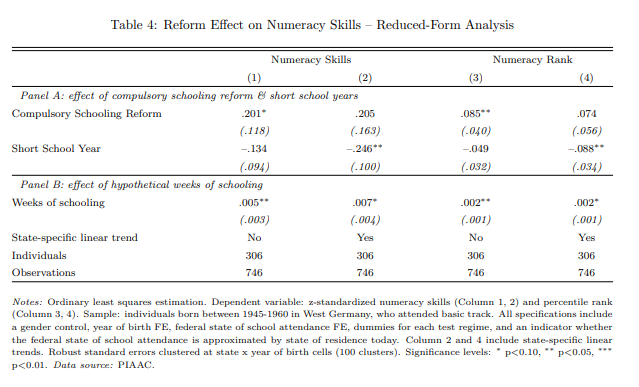
Hampf study that Hanushek cited. Using PIAAC data Hampf used a natural experiment of a German effort to harmonize the start of the school year across state to look at the impact of length in school on numeracy and literacy scores, interesting he found the former more impacted,"... I exploit the staggered introduction of a compulsory ninth grade in basic track schools across German states, as well as a simultaneous reform that introduced short school years to harmonize the start of the school year nation-wide. Instrumental-variable results suggest that the additional year of compulsory schooling increased numeracy skills of basic-track students by about 0.2 standard deviations…Results show that the German compulsory schooling reform increased schooling for basic track students by almost one year, while the concurrent introduction of the two short school years decreased the total length of education by 0.76 years. Difference-indifferences analyses suggest a significant and strong positive long-run reform effect on numeracy skills. Effects on literacy skills cannot be estimated precisely. Two-stage least squares estimates exploiting variation in length of schooling due to the reform verify reduced-form results. One more year of schooling increases numeracy skills of basic track students by 20 percent of a standard deviation (SD) and raises the person’s rank position in the distribution of numeracy skills by 8 to 9 percentage points, which is substantially larger than corresponding OLS estimates. Since skills in PIAAC are assessed many years after the end of compulsory schooling, I provide evidence that individuals affected by the reform benefit from extended schooling throughout their entire working life…"

Core of the numeracy findings, “…Given the strong evidence on the effect of the German compulsory schooling reform on schooling, I exploit exogenous variation in length of schooling due to the reforms to estimate the effect of education on the development of labor-market relevant cognitive skills. Table 4 reports reduced-form effects of the reform on numeracy skills. Again, all specifications control for gender differences in skills and include dummies for each birth cohort and federal state of school attendance. Furthermore, indicators for each test regime account for level differences between test instruments and survey waves.35The introduction of an additional ninth grade led to an increase in numeracy skills of affected basic track students by 0.20 SD, which amounts to approximately 9 PIAAC points (Panel A, Column 1)....Test scores are limited informative if point differences cannot be interpreted economically. Thus, focusing on an individual’s test performance relative to other individuals - e.g., via the position in the overall distribution of skills - provides additional insights of the reform effect from an economic perspective. Column 3 and 4 of Table 4 show that the compulsory schooling reform also increased the percentile rank in the numeracy skill distribution. Being affected by the additional ninth grade raises the position in the numeracy skill distribution by 8.5 percentage points. Being affected by the short school years decreases the rank. When accounting for state-specific linear trends, the positive rank effect of the compulsory schooling reform is entirely offset by the negative effect of short school years for students in the new schooling regime who were exposed to the short school years….”

The Effect of Compulsory Schooling on Skills: Evidence from a Reform in Germany: Extended Excerpt Image 1


On literacy, “…Table 5 shows reduced-form results for literacy skills. Neither the compulsory schooling reform nor the introduction of short school years significantly affected literacy skills. Although the coefficient size of estimated reform effects on literacy skills are positive and large, standard errors exceed the point estimates throughout all specifications….”

Ed Comment, “I agree the effects are often largest on the most capable students, something many of these researchers seem to relegate to the footnotes.”

Note in his conclusions he does mentioned the composition of the student population as an important factor in considering the results“….In the context of ongoing technological change and the associated increase in labor markets’ demand for high-skilled workers, this study implies that schooling expansions may be an efficient way to equip new generations of workers with marketable skills, which are essential for long-run labor market success. Nevertheless, the effect of such reforms is always dependent on the student population affected by the reform.Thus, effects on skills may vary when length of schooling is increased for students attending higher school tracks. Furthermore, the better the schools and teachers are prepared for the reform, the more effective is the reform. Scarcity of resources (e.g., insufficient number of teachers) and poorly designed curricula may prevent positive reform effects….”

  • Test Scores
  • Workforce
    • Education
      • K-12

The Puzzle Of Europe

AI Summary. Eurozone output per hour worked grew an average 1.2% a year from 2000 to 2020, versus 1.8% in the US. The gap is attributed to labor market rigidity, lower technology investment, an aging population, and lower labor force participation — conditions that could foreshadow similar challenges for the US.

John Cochrane The Grumpy Economist
Date Posted:
March 4, 2021
Is Database:
Database

European growth rates have lagged behind the US, with GDP per hour worked in the Eurozone growing at 1.2% annually from 2000 to 2020, compared to 1.8% in the US.

Why does eurozone productivity growth lag behind the US?

Core argument: Eurozone GDP per hour worked grew at an average 1.2% annually from 2000 to 2020, compared with 1.8% in the US.

European growth rates have lagged behind the US, with GDP per hour worked in the Eurozone growing at an average of 1.2% annually from 2000 to 2020, compared to 1.8% in the US. This disparity raises concerns about potential underlying structural issues that could affect other economies, including the US. Factors such as labor market rigidity, lower investment in technology, and demographic challenges contribute to this slower growth. The Eurozone's aging population and lower labor force participation (LFP) rates exacerbate these issues, potentially mirroring trends that could emerge in the US. Policymakers must consider these dynamics as they could signal similar challenges ahead for the US economy, emphasizing the need for strategic reforms to enhance productivity and competitiveness.

Takeaways by Macro Roundup® AI

  1. Eurozone GDP per hour worked grew at an average 1.2% annually from 2000 to 2020, compared with 1.8% in the US.
  2. Labor market rigidity, lower investment in technology, and demographic challenges contribute to the Eurozone's slower growth, with an aging population and lower labor force participation rates compounding the gap.
  3. The European experience raises concerns that similar structural issues could emerge in the US, pointing policymakers toward reforms to strengthen productivity and competitiveness.

John Cochrane, "The Puzzle Of Europe,"The Grumpy Economist, March 3, 2021, https://johnhcochrane.blogspot.com/2021/03/the-puzzle-of-europe.html

“GDP Per Hour Worked,” OECD, Accessed March 4, 2021, https://data.oecd.org/lprdty/gdp-per-hour-worked.htm

Ed Comment:“GDP per a hour worked is better measure since hours worked per capita are different. And Germany is conspicuously missing although it has also declined since 2000 relative to the US. The US workforce has substantially lower academic test scores and test scores have a big impact on productivity. Europe also benefits from free-riding on our outsized contributions of innovation, military expenditures, and healthcare profits. I think a deeper analysis would show that European workers 55 to 65 have increased their workforce participation relative to the US. They may have more women and parttime workers in their workforces. Last time I looked, I was surprised by the differences. What I find disingenuous is liberals never acknowledging the substantial risks of implementing their proposals to redistribute income. The effects are more gradual than conservatives admit. And liberals take full advantage of the overly optimistic conservative sales pitch by ignoring the long term effects. We can always mortgage the future to increase prosperity in the present. At Bain we called that “selling market share,” which was never allowed because most of the value of a future cash flow is in its terminal value.”

Cochrane makes one of the same comparisons we have and contrast Europe's decline relative to the United States and asks, "... France got almost to the US level in 1980. And then slowly slipped behind.The UK seems to be doing ok, but in fact has lost 5 percentage points since the early 2000s peak. And Italy... Once noticeably better off than the UK, and contending with France, Italy's GDP per capita is now lower than it was in 2000. What the heck happened? It could happen here too. Maybe it already has, just not as bad. This should be profoundly unsettling for economists….”

The Puzzle Of Europe: Comments Image 1

Ed Comment:“Yes. Not a pretty picture since they finally caught up in the mid 1990s. Since then, Gordon shows that, unlike the US, they weren’t able to capitalize on IT. They restrict hours, which increases productivity, have an older and higher-scoring workforce, and benefit from free-riding. I also think we continued to improve relatively since 2016.”

Steve Comment: “German ~ looks like France using OECD’s GDP Per Hour Worked series (made everything relative to the US) they were both on a downwards trend going into the pandemic. OECD’s indicator is in $, constant prices 2010 andppP. Added UK as Cochrane used it.”

  • Historical
  • Comparisons
    • Cross-country
  • GDP
    • Growth


Loading More Posts

End of content

No more pages to load

© Copyright 2026 Coherent Research Institute · All Rights Reserved · Privacy · Terms