Edward Conard

Top Ten New York Times Bestselling Author

  • “…a must-read for serious students of economic policy.” - Glenn Hubbard, Dean, Columbia Business School, and former Chairman of the Council of Economic Advisers
  • “…reminds us that inequality sends a signal of what society lacks most, in America’s case, entrepreneurship and risk taking.” - Lawrence Lindsey, CEO, The Lindsey Group, former Director of the National Economic Council
  • “Unintended Consequences provides a provocative interpretation of the causes of the global financial crisis and the policies needed to return to rapid growth. Whether you agree or not, this analysis is well worth reading.” - Nouriel Roubini, New York University; Chairman, Roubini Global Economics
  • “…serious thinking for serious thinkers. …a thought-provoking blueprint for growing middle- and working-class incomes.” - Mitt Romney, former Governor of Massachusetts
  • “Unintended Consequences represents the most cogent and persuasive analysis of the Financial Crisis to date.” - Andrei Shleifer, 1999 John Bates Clark Medal Winner
  • “…a fresh argument for the productive value of inequality.” - David Autor, Professor of Economics, Massachusetts Institute of Technology
  • “…challenges misconceptions that distort our economic debates.” - Arthur Brooks, President of the American Enterprise Institute
  • “Unintended Consequences is far smarter and more thought-provoking than most economics written for the general public” - Greg Mankiw, Harvard University, Former Chairman of the Council of Economic Advisors
  • “Unintended Consequences is full of substance, it is one of the must-read books of the year, and once I finish it I will be giving it a second read through right away.” - Tyler Cowen, Professor, George Mason University
  • “There are an amazing number of good ideas and interesting points made in Unintended Consequences. The thinking underlying it, and the obvious depth of understanding of the author, are very impressive.” - Steven Levitt, coauthor of Freakonomics; 2004 John Bates Clark Medal
  • “Unintended Consequences offers deep and well-argued analyses on almost every issue.” - The New York Times
  • “…a fresh argument for the productive value of inequality.” - David Autor, Professor of Economics, Massachusetts Institute of Technology
Upside of Inequality Oxford Unintended Consequences
Buy the Books
  • Macro Roundup
  • About Roundup
  • About Ed Conard
  • Highlights
  • Topics
  • Subscribe
Edward Conard
  • twitter
  • facebook
  • linkedin
  • youtube

Macro Roundup

  • Email
  • Text Message (SMS)
  • Twitter/X
  • LinkedIn
  • Facebook
  • WhatsApp Message
Subscribe to Macro Roundup Emails
Select topics to choose: articles that mention them (broader) or articles mainly about them (focused)
  • Mentions 0
  • Primary focus 0
Showing all 7,326 Macro Roundup articles
When you search for any topic (like GDP, Inflation, or Banking), choose:
Choose search scope

Saturday, January 26, 2019

Americas Hidden Workforce Returns

AI Summary. The share of US disability claims approved fell to 48% from 62% in 2001, and the number of Americans receiving federal disability benefits declined to 8.5m from a peak of 9m. With unemployment at 3.9%, employers widened candidate searches, and the disability trust fund's projected depletion moved to 2032.

Eric Morath Wall Street Journal
Date Posted:
January 26, 2019
Is Database:
Database

The share of disability claims allowed fell to 48% in 2016, down from 62% in 2001, marking the first time the rate dropped below 50% since 1992.

Are fewer disability approvals and tight labor markets boosting employment?

Core argument: The share of U.S. disability claims allowed fell to 48% in 2016 from 62% in 2001, the first time the approval rate dropped below 50% since 1992.

The share of disability claims allowed fell to 48% in 2016, down from 62% in 2001, marking the first time the rate dropped below 50% since 1992. This decline in approvals has led many to seek employment instead of applying for benefits. As a result, the number of Americans receiving federal disability benefits decreased to 8.5m in December from a peak of 9m four years earlier. The tight labor market, with a low unemployment rate of 3.9% in December, has prompted employers to expand their candidate search, benefiting disabled workers. In 2017, 51,302 people left disability for gainful employment, the highest on record since 2002. This shift is stabilizing the Social Security program, with the disability trust fund's projected depletion extended to 2032 due to lower application rates. The trend reflects a broader economic opportunity for disabled Americans as they re-enter the workforce, contributing to economic growth and reducing reliance on government support.
Takeaways by Macro Roundup® AI

  1. The share of U.S. disability claims allowed fell to 48% in 2016 from 62% in 2001, the first time the approval rate dropped below 50% since 1992.
  2. Americans receiving federal disability benefits fell to 8.5m in December from a peak of 9m four years earlier, and 51,302 people left disability for gainful employment in 2017, the highest since 2002.
  3. Lower disability application rates extended the projected depletion of the Social Security disability trust fund to 2032, while a tight labor market and 3.9% December unemployment prompted employers to widen their candidate search.

“…The share of applying workers whose disability claims were allowed following a medical review in 2016 fell to 48.0%, according to the latest available data from Social Security. That was the first time the rate was below 50% on records dating to 1992. Allowances peaked at 62% in 2001. “A smaller share of people are getting on the program, and that is causing people to not apply and instead to seek alternatives,” said David Autor, an economist at the Massachusetts Institute of Technology. His research was among the first to document the causes and consequences of rising disability claims. Mr. Autor said the recent decrease in disability applications and awards is similar to a crackdown in the early 1980s, which Congress later reversed, setting off a long march higher in claimants….”

Americas Hidden Workforce Returns: Extended Excerpt Image 1

Eric Morath, "America’s Hidden Workforce Returns,"Wall Street Journal, January 26, 2019, https://www.wsj.com/articles/americas-hidden-workforce-returns-11548478801

America’s Hidden Workforce Returns

WYOMING, Mich.—Like many adults with disabilities, Nathan Mort has often struggled to find and hold a job. A conservation group once declined his attempt to volunteer. The 37-year-old West Michigan native, who has a high-functioning form of autism, ended up living with his parents and dependent on government payments.

His fortunes turned several years ago when a local food distributor, Gordon Food Service, found itself short of entry-level workers and developed an internship program for adults with disabilities. Mr. Mort was hired from the program permanently to track warranty claims for the company’s trucks and other equipment. That allowed him to stop collecting federal disability benefits and move into his own home.

“A reason why I like my job is because it’s kind of the same thing over and over again. I really like routines. That is part of my autism,” Mr. Mort said. Making his own money, he added, “makes you feel more worth something.”

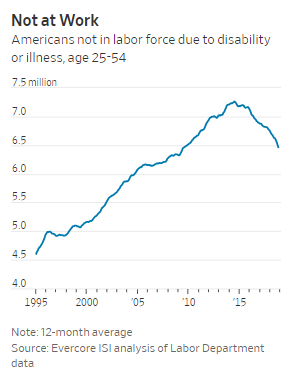
Mr. Mort is part of a wave of disabled Americans joining or returning to the U.S. labor force, breaking a long-running trend that had pushed millions to the sidelines of work. These workers have benefited from a tight economy with a very low overall unemployment rate—3.9% in December, just above lowest level since 1969—as employers in many sectors tackle a shortage of available workers by becoming more creative about whom they recruit.

Americas Hidden Workforce Returns: Extended Excerpt Image 2


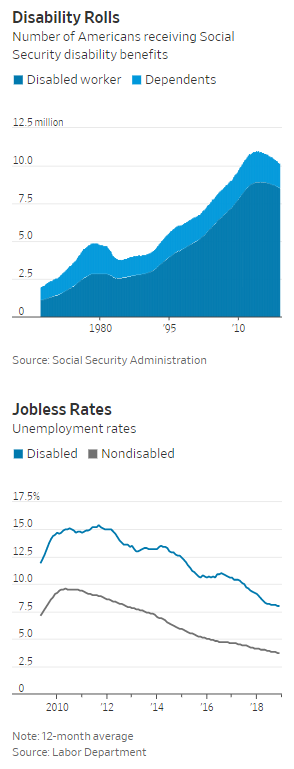
The number of American workers receiving federal disability benefits dropped to 8.5 million in December from a peak of 9 million four years earlier as the share of disabled Americans in the labor force rises. The average monthly jobless rate for the disabled in 2018 was 8%, down 4.6 percentage points from 2014. Unemployment for this group is falling at a faster rate than for the broader population.

“This is really quite a dramatic turnaround,” said Nicole Maestas, an economist at Harvard Medical School who studies the disability system. “Employment among people with disabilities had been declining for a really long time—now it’s not. And it’s not transitory. It’s been increasing for a few years.”

Two factors are at play. First, the tight labor market is causing employers like Gordon Food Service to expand their search for job candidates. Second, Social Security disability benefits—which for many became a de facto second form of unemployment insurance after the last recession ended in 2009—have become harder to access.

When the disability-benefits system found itself on shaky financial footing a few years ago as its rolls swelled, the Social Security Administration pushed new training guidelines to administrative judges who decide which claims will be granted, with the aim of producing more consistent rulings. Before those efforts, judges in some states approved claims at unusually high rates. Members of Congress from both parties in 2011 called for an investigation into the way administrative judges determine whether an applicant qualifies for disability benefits and federal prosecutors began probing the practices of specific judges.

Americas Hidden Workforce Returns: Extended Excerpt Image 3


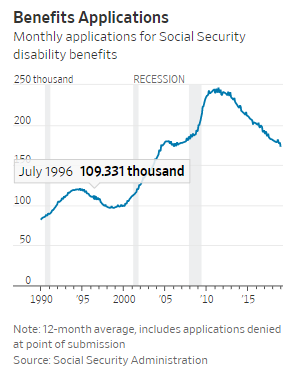
The share of applying workers whose disability claims were allowed following a medical review in 2016 fell to 48.0%, according to the latest available data from Social Security. That was the first time the rate was below 50% on records dating to 1992. Allowances peaked at 62% in 2001.

“A smaller share of people are getting on the program, and that is causing people to not apply and instead to seek alternatives,” said David Autor, an economist at the Massachusetts Institute of Technology. His research was among the first to document the causes and consequences of rising disability claims.

Mr. Autor said the recent decrease in disability applications and awards is similar to a crackdown in the early 1980s, which Congress later reversed, setting off a long march higher in claimants.

Before Gordon Food Service hired him in 2014, Mr. Mort spent a decade without regular work, despite earning a degree from Grand Valley State University near his home. He was let go from a part-time mail-clerk job in college because pain in his hands, a side effect of his condition, made him slow sorting envelopes. He quit another job packing croutons at a food-processing plant after a day. The pace was too fast. He was laid off from another job sorting and hanging clothes at a Salvation Army resale shop. The job presented him with too many distractions. “I probably did not work fast enough,” Mr. Mort said.

The program that brought Mr. Mort to Gordon Food Service came from the company recognizing it may be missing a potential pool of candidates, said Jill Day, senior talent acquisition leader. A suggestion to work with Hope Network, a Grand Rapids, Mich., nonprofit that serves the disabled, came from staff members who had disabled family members.

“For many of our entry-level positions, there’s not enough people going into those roles,” she said. “I think that creates a great opportunity for the company to step back and ask ‘What can we be doing differently?’ There’s an enormous number of people with disabilities who are hungry to work and want to contribute.”

Gordon Food Service was able to tap into what some autism experts call a “splinter skill,” something an autistic person does exceptionally well. For Mr. Mort it’s the ability to process complex strings of numbers combined with being a fast typist—his hands don’t bother him on a keyboard.

As vehicle-warranty administrator, Mr. Mort spends his time copying serial numbers, submitting warranty repair orders, tracking claims, and managing databases. After his internship he was hired for a part-time job. He gradually increased his hours and in November was given a full-time role, taking home more than $400 a week plus health benefits.

“He has incredible focus and never seems to get tired of processing claims,” said Jason Derby, Mr. Mort’s supervisor and Gordon Food Service fleet-maintenance manager.

Mr. Mort uses his earnings to pay for maintenance and property taxes on a two-bedroom condo his parents purchased for him last year. He also enjoys reading fantasy books by J.R.R. Tolkien and Brandon Sanderson, playing “Warcraft” videogames, visiting area zoos and attending Civil War re-enactments.

Mr. Mort’s father, Bruce, now worries less about what will happen once he and his wife are no longer able to care for their son. “It was scary for a while,” he said. “During the recession there weren’t many companies willing to give someone with autism a chance.”

Most people exit the Social Security disability system because they either qualify for retirement benefits or die. Disability pays roughly the equivalent of working full time at the federal minimum wage, $7.25 an hour. Unlike many low-wage jobs, it comes with health insurance, Medicaid, and is adjusted for the cost of living.

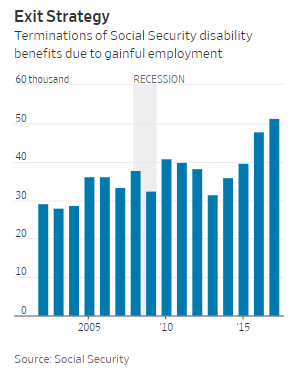
But people like Mr. Mort are no longer a rarity. In 2017, according to the latest data available, 51,302 people left disability because they found “gainful” employment. That is the most on records dating to 2002 and nearly 30% higher than in 2011.

Americas Hidden Workforce Returns: Extended Excerpt Image 4


Disabled workers finding jobs is putting the Social Security program on firmer ground. In 2015, the disability trust fund was nearing exhaustion. Congress ordered that a greater share of federal payroll tax revenue temporarily go to the trust fund to bolster it.

Last year, Social Security Chief Actuary Stephen Goss told members of Congress that the projected depletion of the disability trust fund was extended by four years to 2032, a shift “based primarily on continuing lower-than-expected disability application and incidence rates.”

The tighter labor market is delivering opportunities to a broad swath of workers who were disproportionately affected by the last recession. Unemployment has fallen sharply for blacks, Latinos, younger workers and those without a college education.

But the deeper jobs pool has been particularly crucial for improving the economic outlook of the disabled Americans who have been denied benefits at a higher rate in recent years. Take Keri Dougherty, of Paris, Tenn., a 23-year-old with autism who qualified for Social Security payments as a child but was denied when she applied for disability benefits as an adult. Her family didn’t appeal the decision made in 2013. “We didn’t have the money to fight it,” said Laura Dougherty, Keri Dougherty’s aunt, who raised her since she was 5. “But that’s OK, we had bigger aspirations for Keri anyhow.”

Keri Dougherty, whose disability prevents her from driving, completed high school and two years ago received employment training at the Tennessee Rehabilitation Center in Smyrna, Tenn. Days after finishing her training at the center, she attended a job fair and was soon hired to work at a trailer that collects donated items for the Goodwill Industries charity.

The job allowed her to move into her own apartment in December and to buy an old car, even though she’s unable to drive it. She leaves it parked near the unheated trailer so she can warm up during breaks. She earns about $9 an hour and works 40 hours a week. “I’ve wanted to live independently for a long time,” Ms. Dougherty said. “I wanted to experience how the real world works.”

Patty Kasbohm, director of operations at Hope Network, who helped place Mr. Mort in his job, said the tougher rules around disability programs are causing hardship for some, including less access to job-training programs that come with the benefits. She said people with some forms of autism are particularly challenged because they have high IQs, which can disqualify them for benefits, but their social skills often prevent them from finding work on their own.

Another factor removing pressure on the Social Security disability program is demographics. When the recession hit in 2007, the baby boomers were in their 50s and early 60s. Older workers are more likely to have impediments, including vision challenges and pain, that may qualify them for disability. Now baby boomers are increasingly eligible for Social Security retirement, shifting the payment burden to that program.

Americas Hidden Workforce Returns: Extended Excerpt Image 5


And some older workers are returning to jobs after a stint on benefits.

A onetime construction worker, Elton Crouse went on disability in 2002 after he fell 16½-feet down an elevator shaft in Michigan. “The fall was a breeze,” he said. “It was the sudden stop that got me.” The injury has left his neck too weak for physical jobs.

After five years on disability benefits, Mr. Crouse was told by a counselor assisting in his rehabilitation that because he had improved he needed to pursue part-time work or risk losing payments.

Mr. Crouse, now 59, for years bounced between jobs but in 2017 he landed what he considers the perfect role: greeting customers at Duluth Trading Co. clothing store, among other tasks. The company has been accommodative of his disability, reassigning him to mop floors before store openings when short-term memory loss associated with his accident made operating the cash register too difficult.

“They’re really willing to jump through hoops for me,” he said.

Mr. Crouse hopes to work for the store until he can tap old-age Social Security benefits in a few years. By working part-time, but remaining eligible for benefits under a Social Security program known as Ticket to Work, Mr. Crouse earns between $800 and $1,000 more a month than he would otherwise, which helps offset rising prescription drug costs.

In some cases, Americans with disabilities are creating their own jobs. People with disabilities are more likely to be self-employed than the nondisabled, according to the Labor Department.

Mark Burke, who is deaf, found it hard to find new employment in 2014, after he was let go from his job as athletic director at Model Secondary School for the Deaf in Washington, D.C. One constraint was that he didn’t want to move his family, including his in-laws and young daughter, from their suburban Maryland home.

“Emotionally, it was very tough,” he said, speaking through a signing interpreter. “What can I do? Where can I go?” He said he applied for about 300 federal government jobs. He received two callbacks and no job offers.

After a year out of work—when he received Social Security disability benefits—Mr. Burke, now 48, took a job tending bar. The bar that hired the devoted home brewer is located near Gallaudet University, a federally chartered school for the deaf in Washington. Mr. Burke’s ability to sign and deep knowledge of craft beer helped land him the job, where he also waited on hearing customers.

That led Mr. Burke to think he could open a microbrewery. He pitched his idea at a Gallaudet entrepreneurship competition in the style of the television show “Shark Tank.” He didn’t win, but the experience gave him and his co-owners, friends and fellow Gallaudet alumni, the confidence to open Streetcar 82 Brewing Co. in Hyattsville, Md., in September.

Ryan Maliszewski, director of the Gallaudet Innovation & Entrepreneurship Institute, said technology, including lower-cost video interpreting, has opened doors for deaf people to start businesses and take jobs ranging from app developers to accountants, where they can work remotely.

“I’d always dreamed of owning my own business, but when I graduated from college I didn’t think the opportunity existed,” Mr. Burke said, sitting on a barstool across the room from a silver fermenter, where he recently finished brewing a coffee stout. He added that in the 1990s, deaf people were pushed toward jobs in the government or large corporations that were more able to afford accommodations, such as interpreters.

Now Mr. Burke said he regularly uses email, texting and social media to communicate with vendors and other business associates. “A lot of them don’t realize that I’m deaf until we meet face-to-face,” he said. “Back in the day I don’t think people would want to deal with that—but now I think it’s OK.”

  • Historical
  • Comparisons
    • Other Comparison
  • Workforce
    • Poverty/Crime
    • Unemployment/Participation

U.S. Income More Equal than Advertised

AI Summary. Critics argue that influential estimates of rising U.S. income inequality overstated it by excluding government transfers such as Social Security and health benefits from national income. Adjusted figures show the top 10% income share varying by about 5 percentage points around a century-long average of 35%, rather than 20 points.

James Freeman Wall Street Journal
Date Posted:
January 26, 2019
Is Database:
Database

Critics of Piketty & Saez highlight errors in their methodology, such as excluding gov’t transfer payments from national income calculations. Adjusted figures reveal a much flatter curve in income distribution.

Critics of Piketty & Saez highlight errors in their methodology, such as excluding gov’t transfer payments from...

Does excluding government transfers overstate U.S. income inequality?

Core argument: Adjusted income figures show the U.S. top 10% income share varying by only about 5 percentage points around a century-long average of 35%, versus the roughly 20-point swing reported by Piketty and Saez.

Recent analyses challenge the widely accepted narrative of rising U.S. income inequality, suggesting that previous reports by Piketty and Saez may have overstated the issue. Critics highlight fundamental errors in their methodology, such as excluding government transfer payments like Social Security and health benefits from national income calculations. Adjusted figures reveal a much flatter curve in income distribution, with the top 10% income share varying by only about 5 percentage points from a century-long average of 35%, rather than the 20 percentage point swing previously reported. This suggests that the perceived explosion of inequality may be a myth, emphasizing the need to refine our measurement techniques and focus on creating opportunities rather than viewing income disparity as inherently problematic.

Takeaways by Macro Roundup® AI

  1. Adjusted income figures show the U.S. top 10% income share varying by only about 5 percentage points around a century-long average of 35%, versus the roughly 20-point swing reported by Piketty and Saez.
  2. Critics attribute the overstatement of U.S. inequality to methodological errors in Piketty and Saez's work, including the exclusion of government transfer payments such as Social Security and health benefits from national income.
  3. The analyses argue the perceived explosion of U.S. inequality is a myth, calling for refined measurement techniques and a focus on creating opportunity rather than treating income disparity as inherently problematic.

James Freeman, "U.S. Income More Equal than Advertised,"Wall Street Journal, December 12, 2018, https://www.wsj.com/articles/u-s-income-more-equal-than-advertised-11544574351

U.S. Income More Equal than Advertised

Remember the 2014 bestseller “Capital in the Twenty-First Century” by French economist Thomas Piketty? Beachgoers in the Hamptons couldn’t be seen without it tucked under an arm if they wanted to be regarded as serious people concerned about the plight of the less fortunate. The dismal tale of exploding inequality and capitalist failure has been a recurring theme in political chatter ever since. But a new report highlights just how poorly Mr. Piketty’s thesis has held up under further study.

This column should note that some scholars saw problems right from the start. In a 2014 Journal op-ed, Harvard economist Martin Feldstein ticked off a series of fundamental errors, including those related to Mr. Piketty’s practice of comparing the incomes of top earners with total national income. “National income excludes the value of government transfer payments including Social Security, health benefits and food stamps that are a large and growing part of the personal incomes of low- and middle-income households,” wrote the Harvard prof.

Then Chris Giles of the UK’s Financial Times examined Mr. Piketty’s work and found that “the rock-star French economist appears to have got his sums wrong.” He added:

The data underpinning Professor Piketty’s 577-page tome, which has dominated best-seller lists in recent weeks, contain a series of errors that skew his findings... The central theme of Prof Piketty’s work is that wealth inequalities are heading back up to levels last seen before the first world war. The investigation undercuts this claim, indicating there is little evidence in Prof Piketty’s original sources to bear out the thesis that an increasing share of total wealth is held by the richest few.
Now a new report from the Urban Institute goes back further, to Mr. Piketty’s influential research with University of California, Berkeley professor Emmanuel Saez published in 2003. Stephen Rose writes:

Piketty and Saez’s findings garnered tremendous attention and were cited repeatedly. But many researchers eventually found problems with Piketty and Saez’s approach and developed income inequality measures that led to different findings.
Phil Magness of the American Institute for Economic Research writes today:

In short, the widely reported explosion of inequality in the past three decades is likely a myth, built upon outdated and flawed statistics... Whereas Piketty and Saez show a massive century-long swing of almost 20 percentage points in the income share of the top 10 percent, the adjusted figures show a much flatter curve with a little over half the variation. Inequality still falls and rises under the revised numbers, but at a comparatively subdued rate. Under the adjustments, the top 10 percent income share seldom strays more than 5 percentage points away from a century-long average of about 35 percent.
Perhaps instead of assuming that we’re in the midst of a surging inequality crisis, we should first settle more fundamental issues affecting the accuracy of our measurements over the past century.

Perhaps we should also focus on ensuring an abundance of opportunity, rather than regarding it as a problem when some people inevitably make more than others.

  • Inequality

Sunday, January 27, 2019

Why everything you have said about the determinants of health expenditure is wrong in one million charts: a response to Noah Smith.

AI Summary. The analysis argues that real actual individual consumption per capita predicts national health spending more accurately than real GDP per capita, noting that countries with similar GDP per capita can have widely different health expenditure levels. It concludes that relying on GDP alone is insufficient to explain cross-country variation in healthcare costs.

Random Critical Analysis Random Critical Analysis
Date Posted:
January 27, 2019
Is Database:
Database

Data shows countries with similar GDP per capita can have vastly different health spending levels. Real AIC per capita is a more accurate predictor of health expenditure than Real GDP per capita.

Does household consumption predict health spending better than GDP?

Core argument: Real Actual Individual Consumption (AIC) per capita predicts health expenditure more accurately than real GDP per capita, according to the analysis responding to Noah Smith.

The analysis challenges conventional wisdom by highlighting that Real AIC [Actual Individual Consumption] per capita, rather than Real GDP per capita, is a more accurate predictor of health expenditure. Data shows that countries with similar GDP per capita can have vastly different health spending levels, suggesting that GDP alone is insufficient to explain variations in health expenditure. For instance, the U.S. spends significantly more on healthcare than other nations with comparable GDP per capita, indicating that factors beyond economic output influence spending. This insight urges policymakers to consider broader economic indicators when assessing healthcare costs, as reliance solely on GDP metrics may lead to misguided conclusions and ineffective policy decisions.

Takeaways by Macro Roundup® AI

  1. Real Actual Individual Consumption (AIC) per capita predicts health expenditure more accurately than real GDP per capita, according to the analysis responding to Noah Smith.
  2. Countries with similar GDP per capita show widely differing health spending levels, which the analysis takes as evidence that GDP alone cannot explain variation in health expenditure.
  3. The U.S. spends substantially more on healthcare than nations with comparable GDP per capita, and the analysis argues policymakers should weigh broader economic indicators than GDP when assessing healthcare costs.

Random Critical Analysis, “Why Everything You Have Said About The Determinants Of Health Expenditure Is Wrong In One Million Charts: A Response To Noah Smith,” Random Critical Analysis, November 19, 2018, https://randomcriticalanalysis.com/2018/11/19/why-everything-you-know-about-healthcare-is-wrong-in-one-million-charts-a-response-to-noah-smith/

  • GDP
  • Comparisons
    • Cross-country
  • Workforce
    • Wages/Income

Why everything you have said about the determinants of health expenditure is wrong in one million charts: a response to Noah Smith.

AI Summary. Countries with higher real disposable income per capita tend to spend more on healthcare, but higher spending does not always accompany better health outcomes: the US spends nearly 17% of GDP on healthcare yet ranks below countries like Japan and Italy, which spend around 10% of GDP and achieve higher life expectancy.

Random Critical Analysis Random Critical Analysis
Date Posted:
January 27, 2019
Is Database:
Database

Data shows countries with higher real disposable income per capita spend more on healthcare, yet this doesn’t always correlate with better health outcomes.

Does higher income explain health spending without improving health outcomes?

Core argument: The US spends nearly 17% of GDP on healthcare and has one of the highest real disposable incomes per capita, yet ranks lower in life expectancy than countries spending less.

Real disposable income comparisons reveal significant disparities in health expenditure across countries, challenging conventional wisdom. Data shows that countries with higher real disposable income per capita tend to spend more on healthcare, yet this does not always correlate with better health outcomes. For instance, the US, with one of the highest real disposable incomes, spends nearly 17% of its GDP on healthcare, yet ranks lower in life expectancy compared to countries spending less. Conversely, countries like Japan and Italy, with moderate health expenditure (around 10% of GDP), achieve higher life expectancies. These findings suggest that factors beyond income levels, such as healthcare efficiency and lifestyle choices, play crucial roles in determining health outcomes, urging policymakers to reconsider simplistic income-based assumptions in healthcare planning.

Takeaways by Macro Roundup® AI

  1. The US spends nearly 17% of GDP on healthcare and has one of the highest real disposable incomes per capita, yet ranks lower in life expectancy than countries spending less.
  2. Japan and Italy devote around 10% of GDP to health expenditure while achieving higher life expectancies.
  3. Countries with higher real disposable income per capita tend to spend more on healthcare, but that spending does not always correlate with better health outcomes, suggesting factors such as healthcare efficiency and lifestyle choices matter.

Random Critical Analysis, “Why Everything You Have Said About The Determinants Of Health Expenditure Is Wrong In One Million Charts: A Response To Noah Smith,” Random Critical Analysis, November 19, 2018, https://randomcriticalanalysis.com/2018/11/19/why-everything-you-know-about-healthcare-is-wrong-in-one-million-charts-a-response-to-noah-smith/

Ed Comment:Adjusted for transfers including healthcare (not clear they are adjusted for taxes on transfers. Would also have to be adjusted for deficits which the us gov undercharges hh by 26% on average.

  • Wages/Income
  • Comparisons
    • Cross-country

Top 25 Countries Sorted By The Actual Individual Consumption Per Capita And Releated Variables

AI Summary. A ranking of the top 25 countries by actual individual consumption per capita shows wide disparities in material living standards, with countries at the top typically having higher household disposable incomes and extensive social safety nets. Actual individual consumption measures the goods and services people actually consume, unlike GDP per capita.

Statistics Canada Statistics Canada
Date Posted:
January 27, 2019
Is Database:
Database

Data from @StatisticsCanada reveals the top 25 countries ranked by Actual Individual Consumption (AIC) per capita, highlighting significant disparities in living standards and economic well-being.

How do countries compare on consumption per person rather than output?

Core argument: The ranking of the top 25 countries by Actual Individual Consumption (AIC) per capita shows wide disparities in living standards, with AIC measuring the goods and services individuals consume rather than total output.

The top 25 countries ranked by Actual Individual Consumption (AIC) per capita reveal significant disparities in living standards and economic well-being. AIC per capita is a crucial indicator as it reflects the goods and services consumed by individuals, providing a more accurate measure of material welfare than GDP per capita. Countries with higher AIC per capita often exhibit robust economic structures, efficient resource allocation, and higher household disposable incomes. For instance, nations leading in AIC per capita typically have advanced social safety nets and healthcare systems, contributing to higher life satisfaction and economic stability. The data underscores the importance of policy frameworks that enhance consumption capacity, which can drive economic growth and improve quality of life. Understanding these variables is essential for policymakers aiming to boost economic performance and address inequality.

Takeaways by Macro Roundup® AI

  1. The ranking of the top 25 countries by Actual Individual Consumption (AIC) per capita shows wide disparities in living standards, with AIC measuring the goods and services individuals consume rather than total output.
  2. AIC per capita is presented as a more accurate measure of material welfare than GDP per capita, and countries leading on the measure typically combine higher household disposable incomes with efficient resource allocation.
  3. Countries at the top of the AIC per capita ranking typically have advanced social safety nets and healthcare systems, which are associated with higher life satisfaction and economic stability.

OECD, “Household Disposable Income,” Organisation For Economic Co-Operation and Development, Accessed May 14, 2020, https://data.oecd.org/hha/household-disposable-income.htm

Statistics Canada, “Top 25 Countries Sorted By The Actual Individual Consumption Per Capita And Releated Variables,” Statistics Canada, Accessed May 14, 2020, https://www150.statcan.gc.ca/n1/daily-quotidien/140509/t140509b001-eng.htm

Ed Comment:Real Actual Individual Consumption per capita by country 2011 from the world bank via Canada adjust for purchasing power The actual individual consumption (AIC) indicator is also calculated by the ICP. It includes the goods and services consumed by households, regardless of whether they are produced or paid for by the households. To this are added the individual expenditures of governments and non-profit institutions serving households.

  • Wages/Income
  • Comparisons
    • Cross-country


Loading More Posts

End of content

No more pages to load

© Copyright 2026 Coherent Research Institute · All Rights Reserved · Privacy · Terms